Project: SP500 Companies#
import seaborn as sns
import numpy as np
import pandas as pd
import matplotlib.pyplot as plt
import requests
from io import StringIO
The following code performs a series of steps to retrieve and display data from a webpage:
It sets a URL that points to the Wikipedia page listing all S&P 500 companies.
It creates a headers dictionary to pretend the request is coming from a regular web browser (this helps avoid being blocked).
It downloads the webpage’s HTML using requests.get().
It uses pandas read_html to scan the HTML and automatically extract any tables on the page.
read_html returns a list of tables, so [0] selects the first table — the one containing the S&P 500 companies.
df.head() then displays the first few rows of that table.
url = "https://en.wikipedia.org/wiki/List_of_S%26P_500_companies"
headers = {"User-Agent": "Mozilla/5.0"}

html = requests.get(url, headers=headers).text

df = pd.read_html(StringIO(html))[0]
df.head()
| Symbol | Security | GICS Sector | GICS Sub-Industry | Headquarters Location | Date added | CIK | Founded | |
|---|---|---|---|---|---|---|---|---|
| 0 | MMM | 3M | Industrials | Industrial Conglomerates | Saint Paul, Minnesota | 1957-03-04 | 66740 | 1902 |
| 1 | AOS | A. O. Smith | Industrials | Building Products | Milwaukee, Wisconsin | 2017-07-26 | 91142 | 1916 |
| 2 | ABT | Abbott Laboratories | Health Care | Health Care Equipment | North Chicago, Illinois | 1957-03-04 | 1800 | 1888 |
| 3 | ABBV | AbbVie | Health Care | Biotechnology | North Chicago, Illinois | 2012-12-31 | 1551152 | 2013 (1888) |
| 4 | ACN | Accenture | Information Technology | IT Consulting & Other Services | Dublin, Ireland | 2011-07-06 | 1467373 | 1989 |
sectors = df['GICS Sector'].to_list()
years = df['Founded'].to_list()
companies = df['Security'].to_list()
Sectors#
num_stocks = len(sectors)
num_stocks
503
Unique Sectors#
unique_sectors = []
for sector in sectors:
    if sector not in unique_sectors:
        unique_sectors.append(sector)

unique_sectors
['Industrials',
 'Health Care',
 'Information Technology',
 'Utilities',
 'Financials',
 'Materials',
 'Consumer Discretionary',
 'Real Estate',
 'Communication Services',
 'Consumer Staples',
 'Energy']
len(unique_sectors)
11
Frequencies of the Sectors#
sector_frequency = {}
for sector in sectors:
    sector_frequency[sector] = sector_frequency.get(sector, 0)+1

sector_frequency
{'Industrials': 79,
 'Health Care': 60,
 'Information Technology': 70,
 'Utilities': 31,
 'Financials': 75,
 'Materials': 26,
 'Consumer Discretionary': 49,
 'Real Estate': 31,
 'Communication Services': 23,
 'Consumer Staples': 37,
 'Energy': 22}
total = 0
for frequency in sector_frequency.values():
    total += frequency
total
503
most_frequent, highest_frequency = '', 0

for sector, frequency in sector_frequency.items():
    if frequency > highest_frequency:
        most_frequent, highest_frequency = sector, frequency

most_frequent, highest_frequency
('Industrials', 79)
least_frequent, lowest_frequency = '', len(sectors)

for sector, frequency in sector_frequency.items():
    if frequency < lowest_frequency:
       least_frequent, lowest_frequency = sector, frequency

least_frequent, lowest_frequency
('Energy', 22)
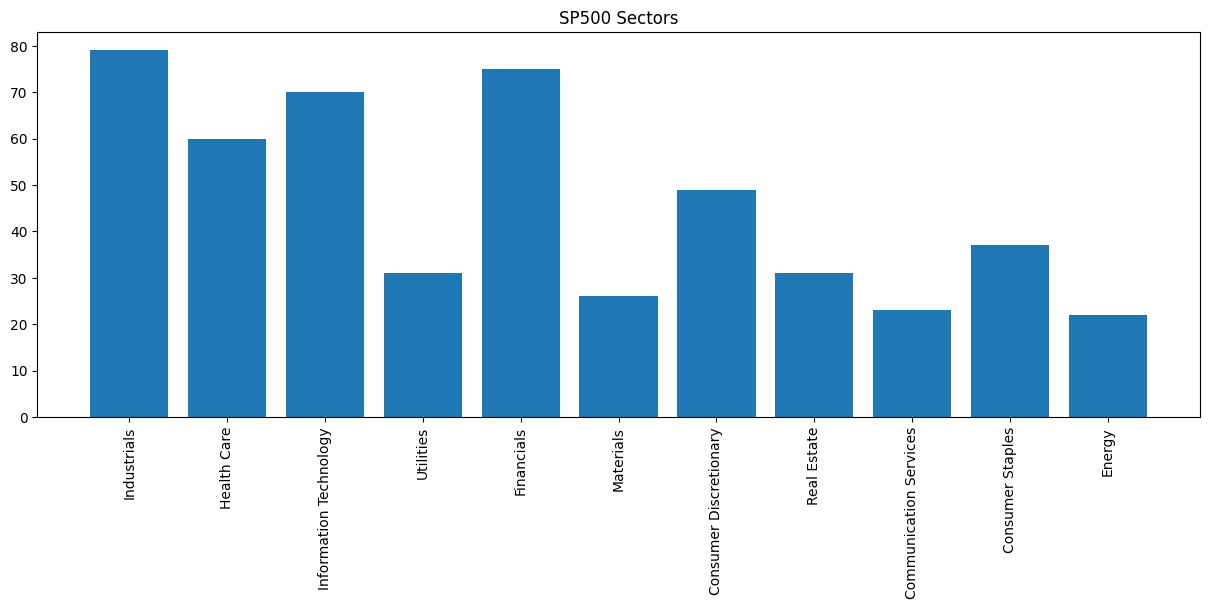
Visualization of Frequencies#
plt.figure(figsize=(15,5))
plt.title('SP500 Sectors')
plt.bar(sector_frequency.keys(), sector_frequency.values())
plt.xticks(rotation=90);
sorted_frequency_list = list(sector_frequency.values())
sorted_frequency_list
[79, 60, 70, 31, 75, 26, 49, 31, 23, 37, 22]
sorted_frequency_list.sort(reverse=True)
sorted_frequency_list
[79, 75, 70, 60, 49, 37, 31, 31, 26, 23, 22]
sorted_sector_list = []
for sorted_frequency in sorted_frequency_list:
    for sector, frequency in sector_frequency.items():
        if (frequency == sorted_frequency) & (sector not in sorted_sector_list):
            sorted_sector_list.append(sector)


sorted_sector_list
['Industrials',
 'Financials',
 'Information Technology',
 'Health Care',
 'Consumer Discretionary',
 'Consumer Staples',
 'Utilities',
 'Real Estate',
 'Materials',
 'Communication Services',
 'Energy']
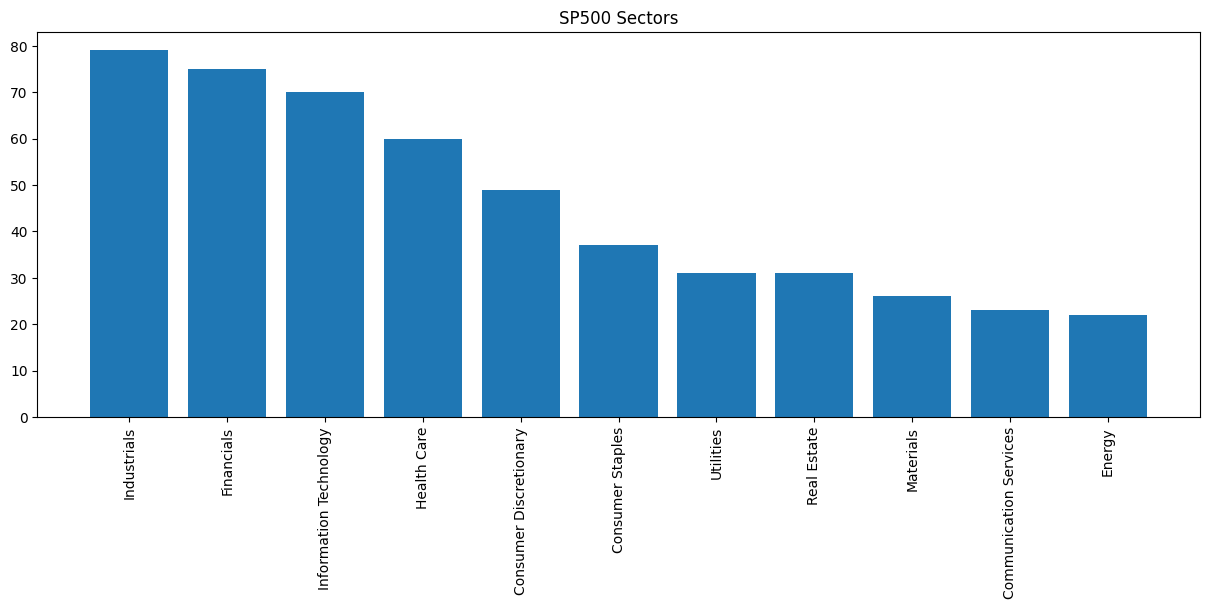
plt.figure(figsize=(15,5))
plt.title('SP500 Sectors')
plt.bar(sorted_sector_list, sorted_frequency_list)
plt.xticks(rotation=90);
Years#
len(years)
503
type(years[0])
str
years
['1902',
 '1916',
 '1888',
 '2013 (1888)',
 '1989',
 '1982',
 '1969',
 '1981',
 '1955',
 '1999',
 '1940',
 '2008',
 '1998',
 '1994',
 '1994',
 '1997',
 '1908',
 '1917',
 '1931',
 '1998',
 '1998',
 '1985',
 '1994',
 '2019 (1860)',
 '1902',
 '1906',
 '1850',
 '1919',
 '1995',
 '1886',
 '1894',
 '1930',
 '1980',
 '1932',
 '1965',
 '1982 (1919)',
 '1954',
 '1990',
 '1977',
 '1967',
 '2012',
 '1994',
 '1995',
 '1902',
 '2004',
 '1927',
 '1892',
 '1983 (1885)',
 '1906',
 '1982',
 '1949',
 '1979',
 '1978',
 '1935',
 '1993',
 '2017',
 '1880',
 '1998 (1923 / 1874)',
 '1931',
 '1897',
 '1839',
 '1966',
 '1976',
 '1978',
 '1988',
 '1985',
 '2009',
 '1784',
 '1916',
 '1996',
 '1979',
 '1989 (1887)',
 '1961',
 '1962',
 '1939',
 '1870',
 '1998',
 '1818',
 '1970',
 '1905',
 '1988',
 '1981',
 '1869',
 '1994',
 '1971',
 '1972',
 '2020 (1915, United Technologies spinoff)',
 '1925',
 '1973',
 '1906',
 '1984',
 '1985',
 '1984',
 '1882',
 '1946',
 '1947',
 '1971',
 '1993',
 '1879',
 '1993',
 '1985',
 '1847',
 '1982',
 '1950',
 '1929',
 '1984',
 '1998',
 '1828',
 '1913',
 '1848',
 '1886',
 '1886',
 '1994',
 '2012',
 '1806',
 '1963',
 '1919',
 '2002',
 '1823',
 '1945',
 '1999',
 '1958',
 '1982',
 '1851',
 '2000',
 '2019',
 '1987',
 '1976',
 '2021 (1989)',
 '2011',
 '1994',
 '1980',
 '1919',
 '1996',
 '1969',
 '1938',
 '2010',
 '1979',
 '1992',
 '1973',
 '1837',
 '2016',
 '1929',
 '1971',
 '1999',
 '2007',
 '2004',
 '1939',
 '1986',
 '1983',
 '1960',
 '2012',
 '1955',
 '2019 (1897)',
 '1978',
 '1995',
 '1904',
 '2017 (1802)',
 '1911',
 '1995',
 '1923',
 '1886',
 '1958',
 '1982',
 '2014 (1946)',
 '1994',
 '1890',
 '1913',
 '1999',
 '1993',
 '1888',
 '1899',
 '1998',
 '1969',
 '1925',
 '1971',
 '1946',
 '1973',
 '1909',
 '1966',
 '2000',
 '1989',
 '1996',
 '1979',
 '1977',
 '1999',
 '1996',
 '1978',
 '1956',
 '1967',
 '1962',
 '1971',
 '1968',
 '1858',
 '1999',
 '1997',
 '1984',
 '1903',
 '2000',
 '2016',
 '2019',
 '2019',
 '1947',
 '1912',
 '1989',
 '1979',
 '1892',
 '1994',
 '2024',
 '1982',
 '1959',
 '1899',
 '1856',
 '1908',
 '1925',
 '1987',
 '2000',
 '1900',
 '1997',
 '1869',
 '1919',
 '1810',
 '1923',
 '1968',
 '1985',
 '1932',
 '1894',
 '2015',
 '1919',
 '1985',
 '1978',
 '1906',
 '1891',
 '1993',
 '1888',
 '1939 (2015)',
 '1888',
 '1961',
 '1866',
 '2011',
 '1911',
 '1988',
 '1983',
 '1912',
 '1991',
 '1859',
 '2000',
 '1968',
 '1977',
 '2000',
 '1958 (1889)',
 '1898',
 '1983',
 '1995',
 '1935',
 '2012',
 '1982',
 '1951',
 '1961',
 '1966',
 '1976',
 '1947',
 '1886',
 '1885',
 '2000 (1799 / 1871)',
 '1906',
 '2022 (Johnson & Johnson spinoff)',
 '1981',
 '1825',
 '2014 (1939)',
 '1872',
 '1958',
 '1997',
 '1976',
 '1975/1977 (1997)',
 '2015 (1869)',
 '1883',
 '2019 (L3 1997, Harris 1895)',
 '1978',
 '1980',
 '2016 (1950)',
 '1988',
 '1969',
 '1954',
 '1895',
 '1876',
 '1879',
 '2010',
 '1998',
 '1995',
 '1959',
 '1904/1946/1959',
 '1998',
 '2007',
 '1856',
 '2009 (1887)',
 '1927',
 '1905',
 '1993',
 '1929',
 '1966',
 '1986',
 '1889',
 '1940',
 '1833',
 '1949',
 '1891',
 '2004',
 '1868',
 '1945',
 '1986',
 '1989',
 '1978',
 '1975',
 '1977',
 '2010',
 '1878',
 '1980',
 '2005 (Molson 1786, Coors 1873)',
 '2012',
 '1997',
 '2012 (1935)',
 '1909',
 '1935',
 '2004 (1865 / 1909)',
 '1928 (2011)',
 '1969',
 '1971',
 '1992',
 '1997',
 '1921',
 '2013 (News Corporation 1980)',
 '2013 (News Corporation 1980)',
 '1984 (1925)',
 '1964',
 '1912',
 '1935',
 '1881/1894 (1980)',
 '1889',
 '1994 (Northrop 1939, Grumman 1930)',
 '2011 (1966)',
 '1992',
 '1940',
 '1993',
 '1980',
 '1953',
 '1957',
 '1920',
 '1934',
 '1986',
 '1999',
 '1906',
 '1977',
 '2020 (1853, United Technologies spinoff)',
 '1905',
 '1959',
 '2003',
 '2005',
 '2025 (Paramount Pictures 1912)',
 '1917',
 '1971',
 '1998',
 '1998',
 '1966',
 '1898',
 '1849',
 '1905',
 '2008 (1847)',
 '2012 (1917)',
 '1985',
 '1845',
 '1993',
 '1883',
 '1920',
 '1879',
 '1837',
 '1937',
 '1983',
 '1875',
 '1903',
 '1985',
 '1972',
 '1956',
 '1997',
 '1985',
 '1967',
 '2025',
 '1967',
 '1962',
 '1922',
 '1969',
 '1963',
 '1988',
 '1971',
 '1998 (1981)',
 '1989',
 '1937',
 '2013',
 '1903',
 '1948',
 '1981',
 '1982',
 '1997',
 '1917',
 '1999',
 '1988',
 '1989',
 '1926',
 '1979',
 '1998',
 '2003',
 '1866',
 '2003',
 '2002',
 '1897',
 '1934',
 '1920',
 '2025',
 '2023',
 '1945',
 '1967',
 '1843',
 '1971',
 '1792',
 '1993',
 '1985',
 '1941',
 '1993',
 '2003',
 '1986',
 '1969',
 '1994',
 '1937',
 '1993',
 '2017',
 '2005',
 '1902',
 '2007',
 '1960',
 '1960',
 '2003',
 '1930',
 '1888',
 '1923',
 '2006 (1902)',
 '1987',
 '2023',
 '2009',
 '1938',
 '1871',
 '1993',
 '1853',
 '1978',
 '1872',
 '1966',
 '1935',
 '1968',
 '2009',
 '1972',
 '1990',
 '1862',
 '1967',
 '1907',
 '1997',
 '1977',
 '1979',
 '1980',
 '1998',
 '2023',
 '1995',
 '1971',
 '1983 (1877)',
 '1989',
 '1961',
 '2017',
 '1958',
 '2016',
 '1909',
 '1967',
 '1927',
 '1999 (1869)',
 '1962',
 '1923',
 '2022 (Warner Bros. 1923)',
 '1968',
 '1958',
 '1896',
 '1852',
 '1970',
 '1923',
 '1970',
 '1900',
 '1956',
 '1908',
 '2016',
 '2005',
 '2002',
 '1909',
 '2011',
 '1997',
 '1969',
 '1927',
 '1952']
for year in years:
    if len(year) > 4:
        print(year)
2013 (1888)
2019 (1860)
1982 (1919)
1983 (1885)
1998 (1923 / 1874)
1989 (1887)
2020 (1915, United Technologies spinoff)
2021 (1989)
2019 (1897)
2017 (1802)
2014 (1946)
1939 (2015)
1958 (1889)
2000 (1799 / 1871)
2022 (Johnson & Johnson spinoff)
2014 (1939)
1975/1977 (1997)
2015 (1869)
2019 (L3 1997, Harris 1895)
2016 (1950)
1904/1946/1959
2009 (1887)
2005 (Molson 1786, Coors 1873)
2012 (1935)
2004 (1865 / 1909)
1928 (2011)
2013 (News Corporation 1980)
2013 (News Corporation 1980)
1984 (1925)
1881/1894 (1980)
1994 (Northrop 1939, Grumman 1930)
2011 (1966)
2020 (1853, United Technologies spinoff)
2025 (Paramount Pictures 1912)
2008 (1847)
2012 (1917)
1998 (1981)
2006 (1902)
1983 (1877)
1999 (1869)
2022 (Warner Bros. 1923)
Cleaning#
years_new = []
for year in years:
    years_new.append(int(year[:4]))

years_new
[1902,
 1916,
 1888,
 2013,
 1989,
 1982,
 1969,
 1981,
 1955,
 1999,
 1940,
 2008,
 1998,
 1994,
 1994,
 1997,
 1908,
 1917,
 1931,
 1998,
 1998,
 1985,
 1994,
 2019,
 1902,
 1906,
 1850,
 1919,
 1995,
 1886,
 1894,
 1930,
 1980,
 1932,
 1965,
 1982,
 1954,
 1990,
 1977,
 1967,
 2012,
 1994,
 1995,
 1902,
 2004,
 1927,
 1892,
 1983,
 1906,
 1982,
 1949,
 1979,
 1978,
 1935,
 1993,
 2017,
 1880,
 1998,
 1931,
 1897,
 1839,
 1966,
 1976,
 1978,
 1988,
 1985,
 2009,
 1784,
 1916,
 1996,
 1979,
 1989,
 1961,
 1962,
 1939,
 1870,
 1998,
 1818,
 1970,
 1905,
 1988,
 1981,
 1869,
 1994,
 1971,
 1972,
 2020,
 1925,
 1973,
 1906,
 1984,
 1985,
 1984,
 1882,
 1946,
 1947,
 1971,
 1993,
 1879,
 1993,
 1985,
 1847,
 1982,
 1950,
 1929,
 1984,
 1998,
 1828,
 1913,
 1848,
 1886,
 1886,
 1994,
 2012,
 1806,
 1963,
 1919,
 2002,
 1823,
 1945,
 1999,
 1958,
 1982,
 1851,
 2000,
 2019,
 1987,
 1976,
 2021,
 2011,
 1994,
 1980,
 1919,
 1996,
 1969,
 1938,
 2010,
 1979,
 1992,
 1973,
 1837,
 2016,
 1929,
 1971,
 1999,
 2007,
 2004,
 1939,
 1986,
 1983,
 1960,
 2012,
 1955,
 2019,
 1978,
 1995,
 1904,
 2017,
 1911,
 1995,
 1923,
 1886,
 1958,
 1982,
 2014,
 1994,
 1890,
 1913,
 1999,
 1993,
 1888,
 1899,
 1998,
 1969,
 1925,
 1971,
 1946,
 1973,
 1909,
 1966,
 2000,
 1989,
 1996,
 1979,
 1977,
 1999,
 1996,
 1978,
 1956,
 1967,
 1962,
 1971,
 1968,
 1858,
 1999,
 1997,
 1984,
 1903,
 2000,
 2016,
 2019,
 2019,
 1947,
 1912,
 1989,
 1979,
 1892,
 1994,
 2024,
 1982,
 1959,
 1899,
 1856,
 1908,
 1925,
 1987,
 2000,
 1900,
 1997,
 1869,
 1919,
 1810,
 1923,
 1968,
 1985,
 1932,
 1894,
 2015,
 1919,
 1985,
 1978,
 1906,
 1891,
 1993,
 1888,
 1939,
 1888,
 1961,
 1866,
 2011,
 1911,
 1988,
 1983,
 1912,
 1991,
 1859,
 2000,
 1968,
 1977,
 2000,
 1958,
 1898,
 1983,
 1995,
 1935,
 2012,
 1982,
 1951,
 1961,
 1966,
 1976,
 1947,
 1886,
 1885,
 2000,
 1906,
 2022,
 1981,
 1825,
 2014,
 1872,
 1958,
 1997,
 1976,
 1975,
 2015,
 1883,
 2019,
 1978,
 1980,
 2016,
 1988,
 1969,
 1954,
 1895,
 1876,
 1879,
 2010,
 1998,
 1995,
 1959,
 1904,
 1998,
 2007,
 1856,
 2009,
 1927,
 1905,
 1993,
 1929,
 1966,
 1986,
 1889,
 1940,
 1833,
 1949,
 1891,
 2004,
 1868,
 1945,
 1986,
 1989,
 1978,
 1975,
 1977,
 2010,
 1878,
 1980,
 2005,
 2012,
 1997,
 2012,
 1909,
 1935,
 2004,
 1928,
 1969,
 1971,
 1992,
 1997,
 1921,
 2013,
 2013,
 1984,
 1964,
 1912,
 1935,
 1881,
 1889,
 1994,
 2011,
 1992,
 1940,
 1993,
 1980,
 1953,
 1957,
 1920,
 1934,
 1986,
 1999,
 1906,
 1977,
 2020,
 1905,
 1959,
 2003,
 2005,
 2025,
 1917,
 1971,
 1998,
 1998,
 1966,
 1898,
 1849,
 1905,
 2008,
 2012,
 1985,
 1845,
 1993,
 1883,
 1920,
 1879,
 1837,
 1937,
 1983,
 1875,
 1903,
 1985,
 1972,
 1956,
 1997,
 1985,
 1967,
 2025,
 1967,
 1962,
 1922,
 1969,
 1963,
 1988,
 1971,
 1998,
 1989,
 1937,
 2013,
 1903,
 1948,
 1981,
 1982,
 1997,
 1917,
 1999,
 1988,
 1989,
 1926,
 1979,
 1998,
 2003,
 1866,
 2003,
 2002,
 1897,
 1934,
 1920,
 2025,
 2023,
 1945,
 1967,
 1843,
 1971,
 1792,
 1993,
 1985,
 1941,
 1993,
 2003,
 1986,
 1969,
 1994,
 1937,
 1993,
 2017,
 2005,
 1902,
 2007,
 1960,
 1960,
 2003,
 1930,
 1888,
 1923,
 2006,
 1987,
 2023,
 2009,
 1938,
 1871,
 1993,
 1853,
 1978,
 1872,
 1966,
 1935,
 1968,
 2009,
 1972,
 1990,
 1862,
 1967,
 1907,
 1997,
 1977,
 1979,
 1980,
 1998,
 2023,
 1995,
 1971,
 1983,
 1989,
 1961,
 2017,
 1958,
 2016,
 1909,
 1967,
 1927,
 1999,
 1962,
 1923,
 2022,
 1968,
 1958,
 1896,
 1852,
 1970,
 1923,
 1970,
 1900,
 1956,
 1908,
 2016,
 2005,
 2002,
 1909,
 2011,
 1997,
 1969,
 1927,
 1952]
min(years_new)
1784
years_new.index(min(years_new))
67
companies[years_new.index(min(years_new))]
'BNY Mellon'
max(years_new)
2025
companies[years_new.index(max(years_new))]
'Paramount Skydance Corporation'
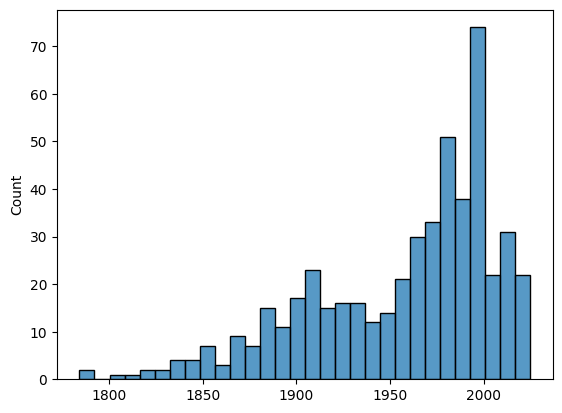
Histogram#
sns.histplot(years_new, bins=30);
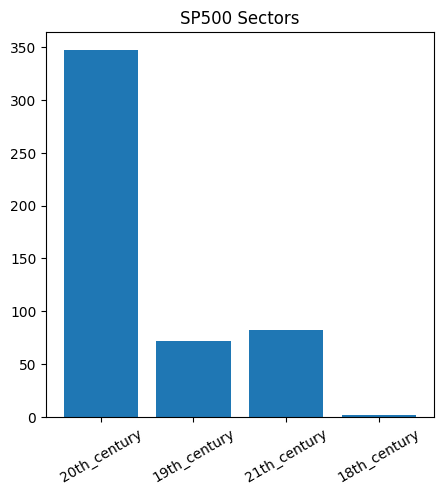
Centuries#
min(years_new), max(years_new)
(1784, 2025)
century_dict = {}

for year in years_new:
    if year < 1800:
        century_dict['18th_century'] = century_dict.get('18th_century', 0) + 1
    elif year < 1900:
        century_dict['19th_century'] = century_dict.get('19th_century', 0) + 1
    elif year < 2000:
        century_dict['20th_century'] = century_dict.get('20th_century', 0) + 1
    else:
        century_dict['21th_century'] = century_dict.get('21th_century', 0) + 1

century_dict
{'20th_century': 347,
 '19th_century': 72,
 '21th_century': 82,
 '18th_century': 2}
plt.figure(figsize=(5,5))
plt.title('SP500 Sectors')
plt.bar(century_dict.keys(), century_dict.values())
plt.xticks(rotation=30);
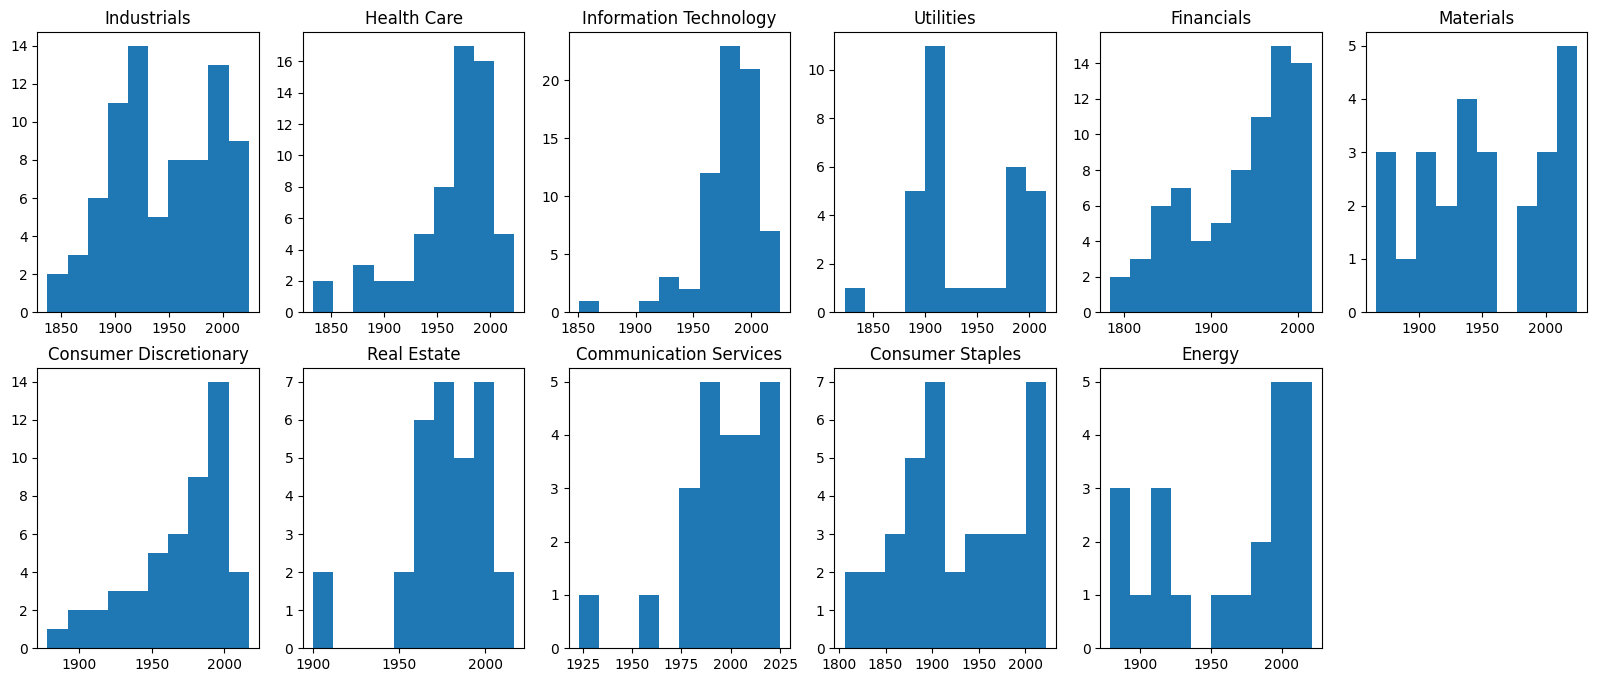
Sectors and Years#
sector_year_dict = {sector:[]  for sector in unique_sectors}

for i in range(num_stocks):
    sector_year_dict[sectors[i]].append(years_new[i])

sector_year_dict
{'Industrials': [1902,
  1916,
  1908,
  1930,
  1949,
  1993,
  1916,
  1962,
  1998,
  1905,
  2020,
  1925,
  1929,
  1982,
  1980,
  1919,
  1992,
  1837,
  1929,
  1955,
  1911,
  1994,
  1890,
  1899,
  1979,
  1967,
  1971,
  2016,
  1892,
  2024,
  1959,
  1899,
  1906,
  1888,
  1888,
  2011,
  1988,
  1912,
  1859,
  1961,
  1947,
  1885,
  2019,
  1969,
  1895,
  1995,
  1929,
  1935,
  1881,
  1994,
  1934,
  2020,
  1905,
  1917,
  1971,
  1998,
  1966,
  1997,
  1922,
  1998,
  1903,
  1948,
  1920,
  1967,
  1843,
  1923,
  1871,
  1993,
  2009,
  1862,
  1967,
  1907,
  1997,
  2023,
  1971,
  1927,
  1999,
  1968,
  2011],
 'Health Care': [1888,
  2013,
  1999,
  1997,
  1980,
  1931,
  1897,
  1976,
  1978,
  1979,
  1989,
  1971,
  1985,
  1984,
  1947,
  1982,
  1958,
  1996,
  1969,
  1979,
  1999,
  1958,
  2014,
  1994,
  1987,
  1968,
  1932,
  1985,
  1961,
  1983,
  1991,
  2000,
  1995,
  1982,
  1886,
  1978,
  1876,
  1833,
  1949,
  1891,
  1945,
  2010,
  1980,
  1849,
  1967,
  1988,
  1989,
  1937,
  2023,
  1985,
  1941,
  2006,
  1977,
  1979,
  1989,
  1961,
  1958,
  1923,
  1927,
  1952],
 'Information Technology': [1989,
  1982,
  1969,
  1998,
  1932,
  1965,
  1977,
  1967,
  2012,
  2004,
  1982,
  1961,
  1988,
  1984,
  1984,
  1994,
  1851,
  2011,
  2010,
  2016,
  1993,
  1996,
  1956,
  1999,
  2000,
  1979,
  1982,
  1997,
  2015,
  1939,
  1911,
  1968,
  1983,
  1966,
  2014,
  1975,
  1980,
  1989,
  1978,
  1975,
  1997,
  1928,
  1992,
  1993,
  1953,
  1999,
  1977,
  2003,
  2005,
  1985,
  1985,
  2025,
  1981,
  1999,
  1988,
  1979,
  2003,
  2002,
  1993,
  1986,
  2007,
  1960,
  1960,
  1930,
  1978,
  1966,
  1995,
  1970,
  2005,
  1969],
 'Utilities': [1981,
  1917,
  1902,
  1906,
  1886,
  1906,
  1882,
  1886,
  1823,
  1999,
  1983,
  1995,
  1904,
  1886,
  1913,
  1909,
  1966,
  2000,
  1997,
  1984,
  1912,
  1992,
  1905,
  1985,
  1920,
  1903,
  1998,
  1945,
  2016,
  1896,
  1909],
 'Financials': [1955,
  1931,
  1850,
  1919,
  1894,
  1982,
  1990,
  1995,
  1927,
  1892,
  1998,
  1839,
  1988,
  1985,
  2009,
  1784,
  1939,
  1994,
  1973,
  1971,
  1985,
  1950,
  1998,
  1828,
  1848,
  2012,
  2000,
  1925,
  1973,
  1978,
  1968,
  1858,
  1984,
  1947,
  2000,
  1900,
  1869,
  1810,
  1866,
  1977,
  2000,
  1935,
  1976,
  2000,
  1825,
  1976,
  1959,
  1856,
  1905,
  1966,
  1868,
  1909,
  1935,
  1969,
  1971,
  1889,
  1998,
  1845,
  1879,
  1937,
  1875,
  1962,
  1971,
  2013,
  1917,
  1792,
  2003,
  1937,
  1853,
  1872,
  1968,
  1958,
  1967,
  1852,
  2016],
 'Materials': [1940,
  1994,
  2019,
  1935,
  1880,
  1946,
  2019,
  2019,
  2017,
  1923,
  1912,
  1958,
  1898,
  1879,
  2007,
  1993,
  2004,
  1921,
  1940,
  1959,
  1883,
  1866,
  1934,
  2025,
  1993,
  1909],
 'Consumer Discretionary': [2008,
  1994,
  1994,
  1979,
  1966,
  1996,
  1972,
  1993,
  1938,
  1973,
  1960,
  2012,
  1978,
  1995,
  1996,
  1903,
  1989,
  1908,
  1925,
  1923,
  1919,
  1978,
  1988,
  1954,
  1998,
  1904,
  1998,
  1927,
  1940,
  1986,
  1878,
  1964,
  2011,
  1980,
  1957,
  1993,
  1956,
  1967,
  1982,
  1997,
  1971,
  2017,
  2003,
  1987,
  1938,
  1990,
  1956,
  2002,
  1997],
 'Real Estate': [1994,
  1995,
  1978,
  1970,
  1981,
  1906,
  1987,
  1994,
  2004,
  1998,
  1969,
  1971,
  1977,
  1962,
  1985,
  1993,
  2012,
  1951,
  1958,
  1977,
  1983,
  1972,
  1969,
  1963,
  1989,
  2003,
  1972,
  1998,
  2017,
  1970,
  1900],
 'Communication Services': [1998,
  1998,
  1983,
  1993,
  1963,
  1982,
  2019,
  2019,
  2010,
  1986,
  2004,
  1997,
  2013,
  2013,
  1986,
  2025,
  1994,
  1993,
  2023,
  2009,
  1983,
  1923,
  2022],
 'Consumer Staples': [1985,
  1902,
  1870,
  1818,
  1869,
  1847,
  1913,
  1886,
  1806,
  1919,
  1945,
  1976,
  1939,
  1986,
  1946,
  1856,
  1894,
  1891,
  1906,
  2022,
  1981,
  1872,
  2015,
  1883,
  2016,
  1889,
  2005,
  2012,
  2012,
  1898,
  2008,
  1837,
  1897,
  1969,
  1902,
  1935,
  1962],
 'Energy': [1954,
  2017,
  1879,
  2002,
  2021,
  1971,
  2007,
  1999,
  1888,
  1989,
  1999,
  1919,
  1997,
  2009,
  1920,
  1906,
  2012,
  1926,
  2005,
  1888,
  1980,
  1908]}
plt.figure(figsize=(20,8))
k = 1
for sector  in sector_year_dict.keys():
    plt.subplot(2, len(sector_year_dict)//2+1,k)
    plt.hist(sector_year_dict[sector])
    plt.title(sector)
    k += 1;
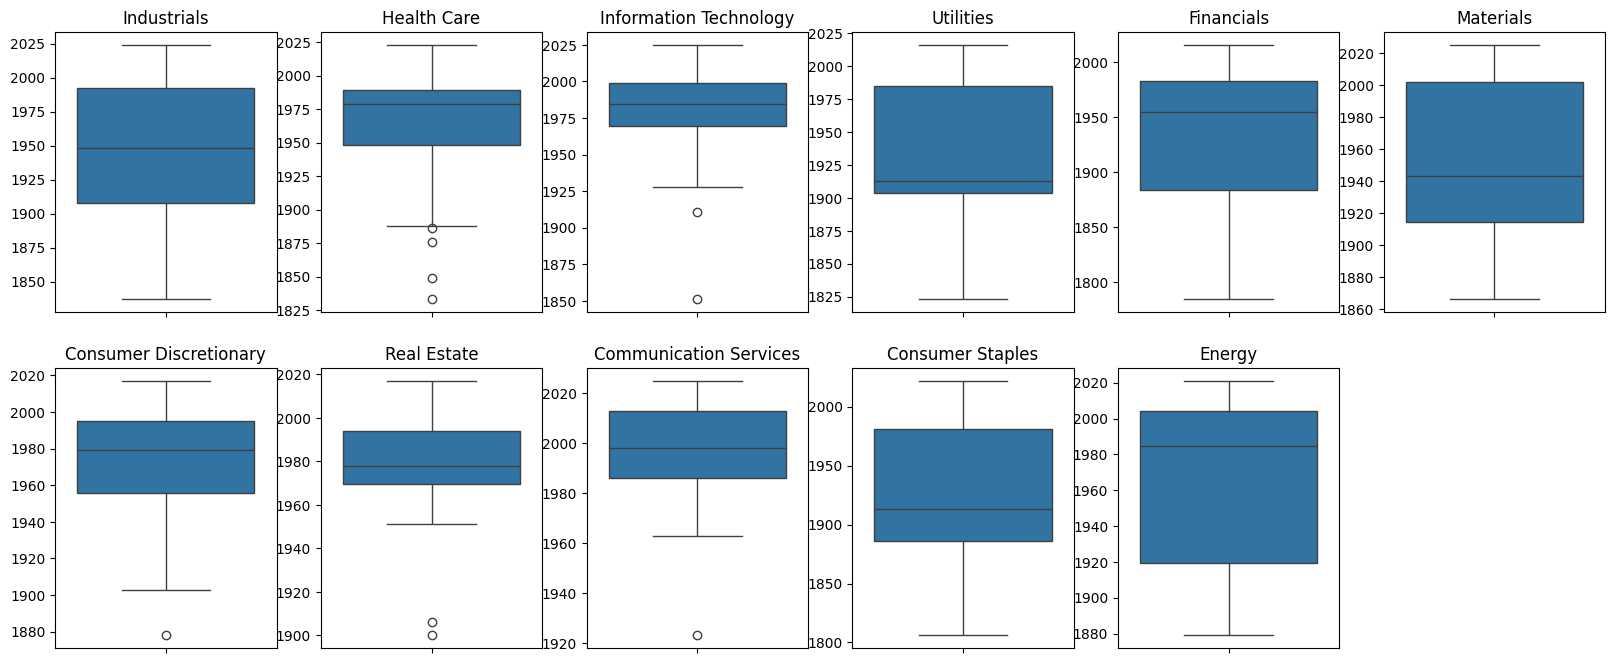
plt.figure(figsize=(20,8))
k = 1
for sector  in sector_year_dict.keys():
    plt.subplot(2, len(sector_year_dict)//2+1,k)
    sns.boxplot(sector_year_dict[sector])
    plt.title(sector)
    k += 1;
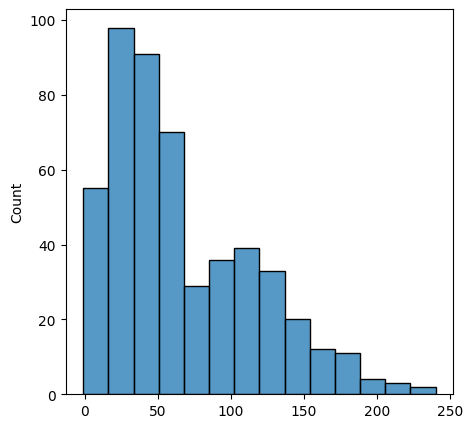
Ages#
current_year = 2024
ages = [current_year-i for i in years_new]
ages[:5]
[122, 108, 136, 11, 35]
plt.figure(figsize=(5,5))
sns.histplot(ages);
sector_age_dict = {sector:[] for sector in unique_sectors}

for i in range(num_stocks):
    sector_age_dict[sectors[i]].append(current_year-years_new[i])

sector_age_dict
{'Industrials': [122,
  108,
  116,
  94,
  75,
  31,
  108,
  62,
  26,
  119,
  4,
  99,
  95,
  42,
  44,
  105,
  32,
  187,
  95,
  69,
  113,
  30,
  134,
  125,
  45,
  57,
  53,
  8,
  132,
  0,
  65,
  125,
  118,
  136,
  136,
  13,
  36,
  112,
  165,
  63,
  77,
  139,
  5,
  55,
  129,
  29,
  95,
  89,
  143,
  30,
  90,
  4,
  119,
  107,
  53,
  26,
  58,
  27,
  102,
  26,
  121,
  76,
  104,
  57,
  181,
  101,
  153,
  31,
  15,
  162,
  57,
  117,
  27,
  1,
  53,
  97,
  25,
  56,
  13],
 'Health Care': [136,
  11,
  25,
  27,
  44,
  93,
  127,
  48,
  46,
  45,
  35,
  53,
  39,
  40,
  77,
  42,
  66,
  28,
  55,
  45,
  25,
  66,
  10,
  30,
  37,
  56,
  92,
  39,
  63,
  41,
  33,
  24,
  29,
  42,
  138,
  46,
  148,
  191,
  75,
  133,
  79,
  14,
  44,
  175,
  57,
  36,
  35,
  87,
  1,
  39,
  83,
  18,
  47,
  45,
  35,
  63,
  66,
  101,
  97,
  72],
 'Information Technology': [35,
  42,
  55,
  26,
  92,
  59,
  47,
  57,
  12,
  20,
  42,
  63,
  36,
  40,
  40,
  30,
  173,
  13,
  14,
  8,
  31,
  28,
  68,
  25,
  24,
  45,
  42,
  27,
  9,
  85,
  113,
  56,
  41,
  58,
  10,
  49,
  44,
  35,
  46,
  49,
  27,
  96,
  32,
  31,
  71,
  25,
  47,
  21,
  19,
  39,
  39,
  -1,
  43,
  25,
  36,
  45,
  21,
  22,
  31,
  38,
  17,
  64,
  64,
  94,
  46,
  58,
  29,
  54,
  19,
  55],
 'Utilities': [43,
  107,
  122,
  118,
  138,
  118,
  142,
  138,
  201,
  25,
  41,
  29,
  120,
  138,
  111,
  115,
  58,
  24,
  27,
  40,
  112,
  32,
  119,
  39,
  104,
  121,
  26,
  79,
  8,
  128,
  115],
 'Financials': [69,
  93,
  174,
  105,
  130,
  42,
  34,
  29,
  97,
  132,
  26,
  185,
  36,
  39,
  15,
  240,
  85,
  30,
  51,
  53,
  39,
  74,
  26,
  196,
  176,
  12,
  24,
  99,
  51,
  46,
  56,
  166,
  40,
  77,
  24,
  124,
  155,
  214,
  158,
  47,
  24,
  89,
  48,
  24,
  199,
  48,
  65,
  168,
  119,
  58,
  156,
  115,
  89,
  55,
  53,
  135,
  26,
  179,
  145,
  87,
  149,
  62,
  53,
  11,
  107,
  232,
  21,
  87,
  171,
  152,
  56,
  66,
  57,
  172,
  8],
 'Materials': [84,
  30,
  5,
  89,
  144,
  78,
  5,
  5,
  7,
  101,
  112,
  66,
  126,
  145,
  17,
  31,
  20,
  103,
  84,
  65,
  141,
  158,
  90,
  -1,
  31,
  115],
 'Consumer Discretionary': [16,
  30,
  30,
  45,
  58,
  28,
  52,
  31,
  86,
  51,
  64,
  12,
  46,
  29,
  28,
  121,
  35,
  116,
  99,
  101,
  105,
  46,
  36,
  70,
  26,
  120,
  26,
  97,
  84,
  38,
  146,
  60,
  13,
  44,
  67,
  31,
  68,
  57,
  42,
  27,
  53,
  7,
  21,
  37,
  86,
  34,
  68,
  22,
  27],
 'Real Estate': [30,
  29,
  46,
  54,
  43,
  118,
  37,
  30,
  20,
  26,
  55,
  53,
  47,
  62,
  39,
  31,
  12,
  73,
  66,
  47,
  41,
  52,
  55,
  61,
  35,
  21,
  52,
  26,
  7,
  54,
  124],
 'Communication Services': [26,
  26,
  41,
  31,
  61,
  42,
  5,
  5,
  14,
  38,
  20,
  27,
  11,
  11,
  38,
  -1,
  30,
  31,
  1,
  15,
  41,
  101,
  2],
 'Consumer Staples': [39,
  122,
  154,
  206,
  155,
  177,
  111,
  138,
  218,
  105,
  79,
  48,
  85,
  38,
  78,
  168,
  130,
  133,
  118,
  2,
  43,
  152,
  9,
  141,
  8,
  135,
  19,
  12,
  12,
  126,
  16,
  187,
  127,
  55,
  122,
  89,
  62],
 'Energy': [70,
  7,
  145,
  22,
  3,
  53,
  17,
  25,
  136,
  35,
  25,
  105,
  27,
  15,
  104,
  118,
  12,
  98,
  19,
  136,
  44,
  116]}
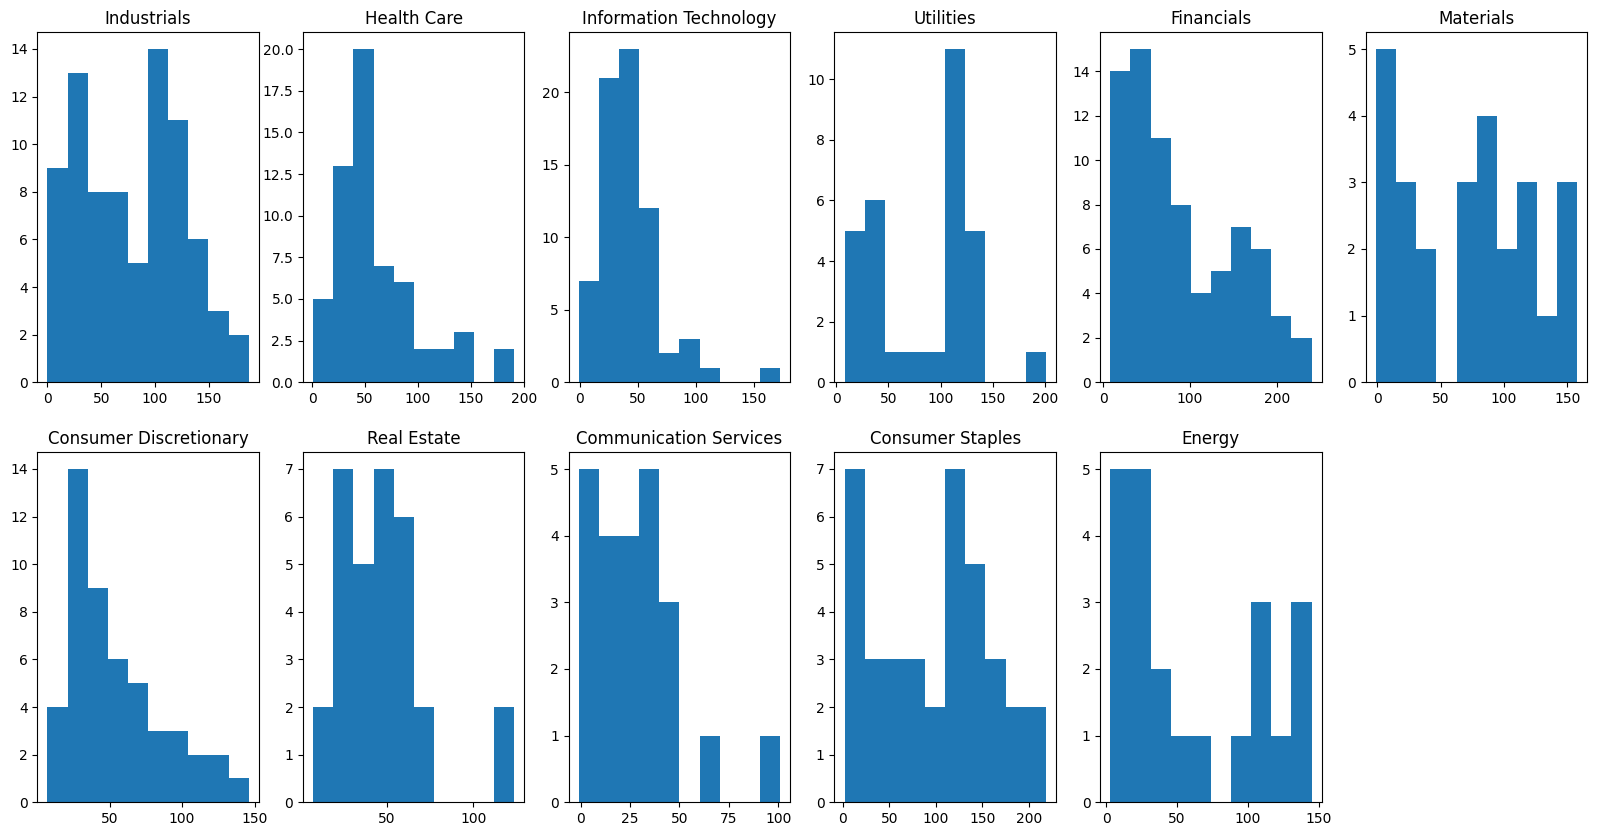
plt.figure(figsize=(20,10))
k = 1
for sector in sector_age_dict.keys():
    plt.subplot(2, len(sector_age_dict)//2+1,k)
    plt.hist(sector_age_dict[sector])
    plt.title(sector)
    k += 1;
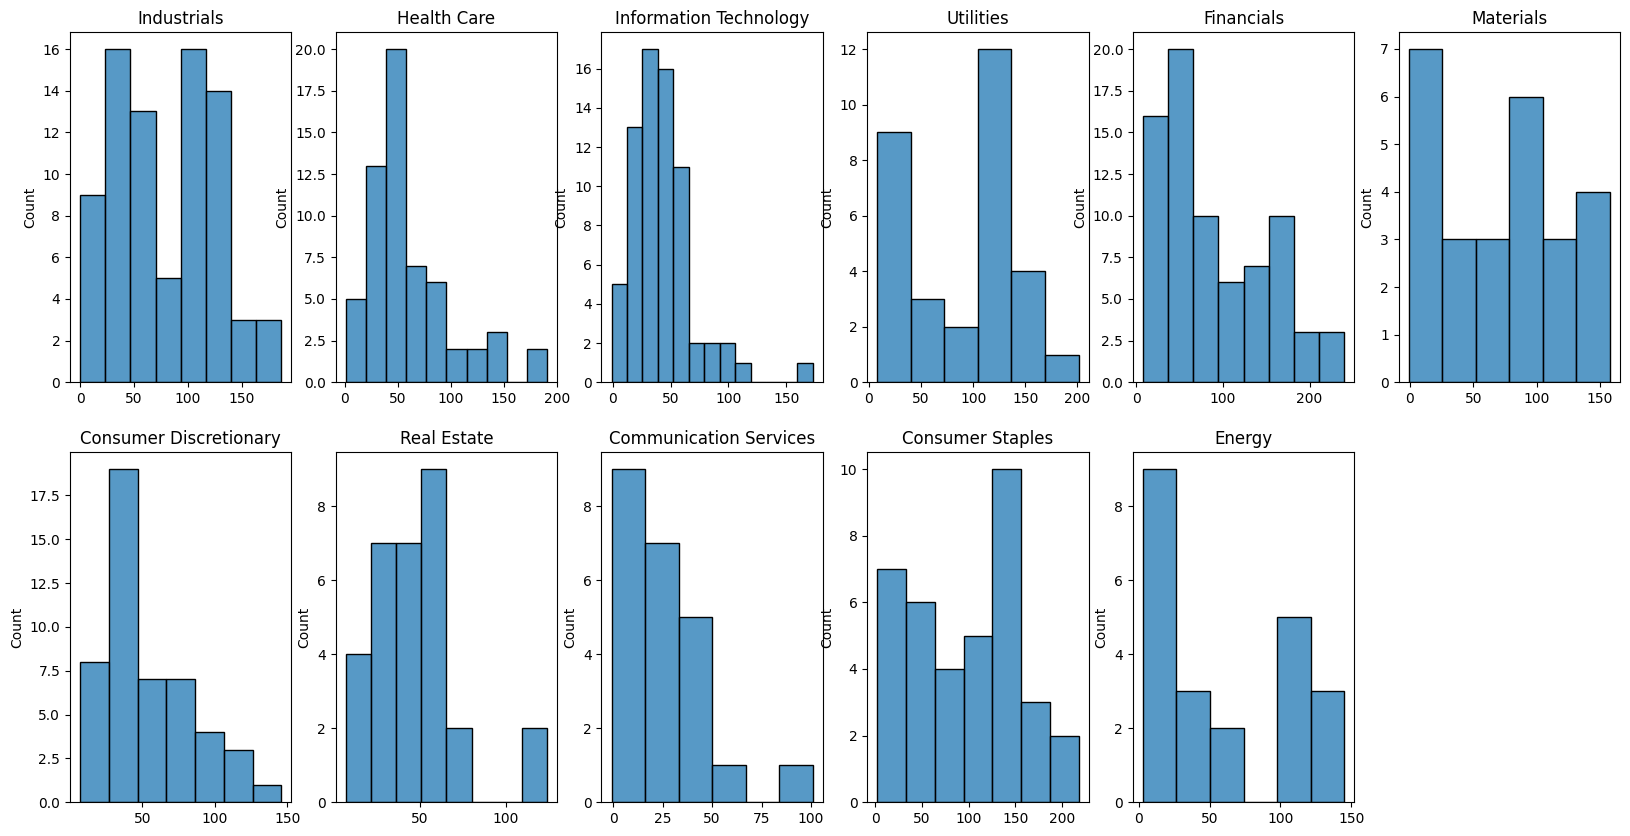
plt.figure(figsize=(20,10))
k = 1
for sector in sector_age_dict.keys():
    plt.subplot(2, len(sector_age_dict)//2+1,k)
    sns.histplot(sector_age_dict[sector])
    plt.title(sector)
    k += 1;
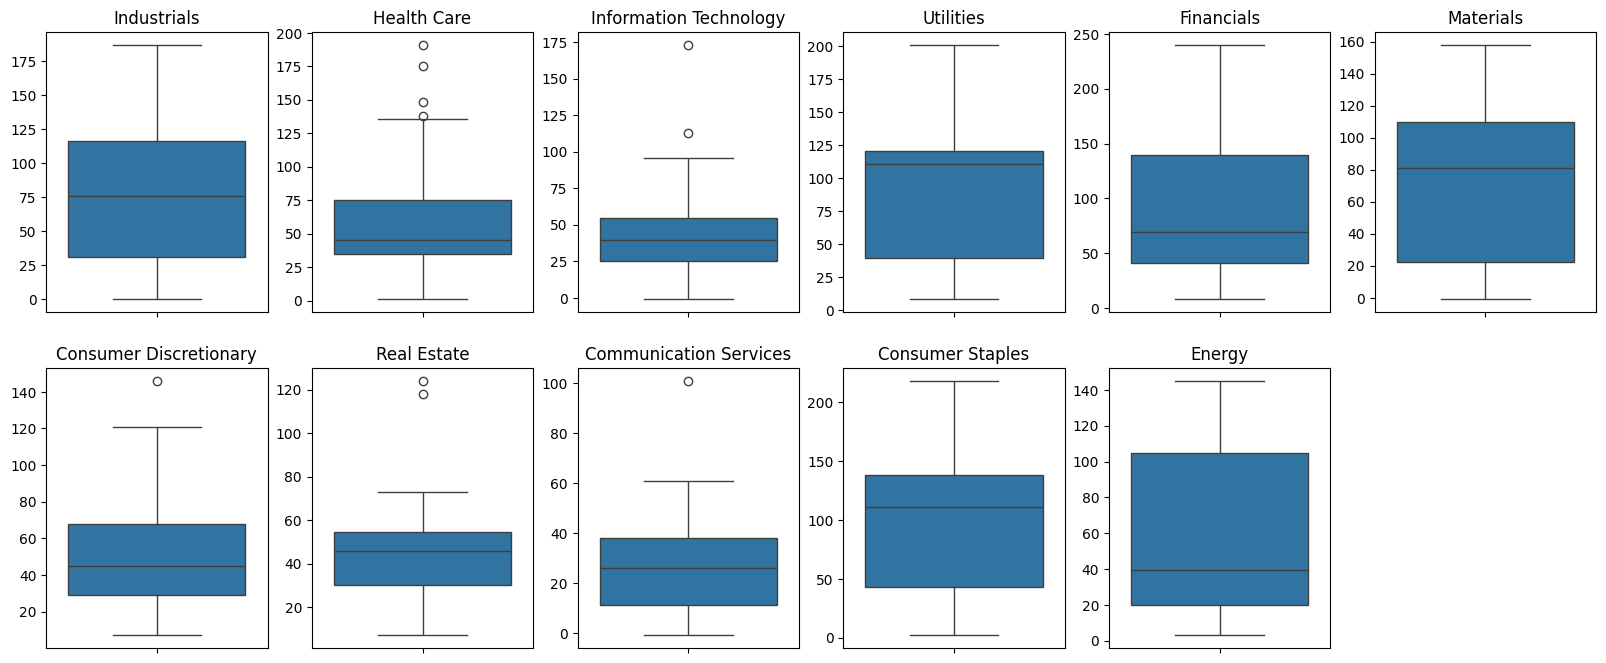
plt.figure(figsize=(20,8))
k = 1
for sector in sector_age_dict.keys():
    plt.subplot(2, len(sector_age_dict)//2+1,k)
    sns.boxplot(sector_age_dict[sector])
    plt.title(sector)
    k += 1;
import numpy as np
for sector, ages in sector_age_dict.items():
    print(f'Sector: {sector:<25} Mean Age: {np.mean(ages):<10.2f} Median Age: {np.median(ages):.2f}')
Sector: Industrials               Mean Age: 77.84      Median Age: 76.00
Sector: Health Care               Mean Age: 59.90      Median Age: 45.50
Sector: Information Technology    Mean Age: 42.80      Median Age: 39.50
Sector: Utilities                 Mean Age: 88.32      Median Age: 111.00
Sector: Financials                Mean Age: 90.07      Median Age: 69.00
Sector: Materials                 Mean Age: 71.19      Median Age: 81.00
Sector: Consumer Discretionary    Mean Age: 53.80      Median Age: 45.00
Sector: Real Estate               Mean Age: 46.65      Median Age: 46.00
Sector: Communication Services    Mean Age: 26.78      Median Age: 26.00
Sector: Consumer Staples          Mean Age: 97.81      Median Age: 111.00
Sector: Energy                    Mean Age: 60.55      Median Age: 39.50
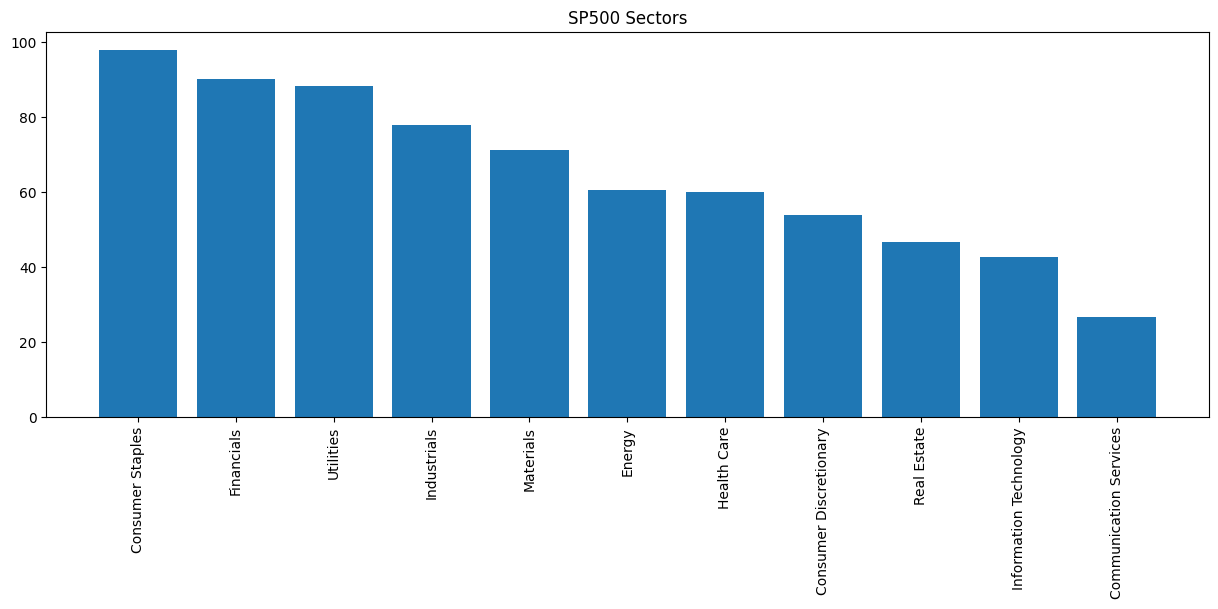
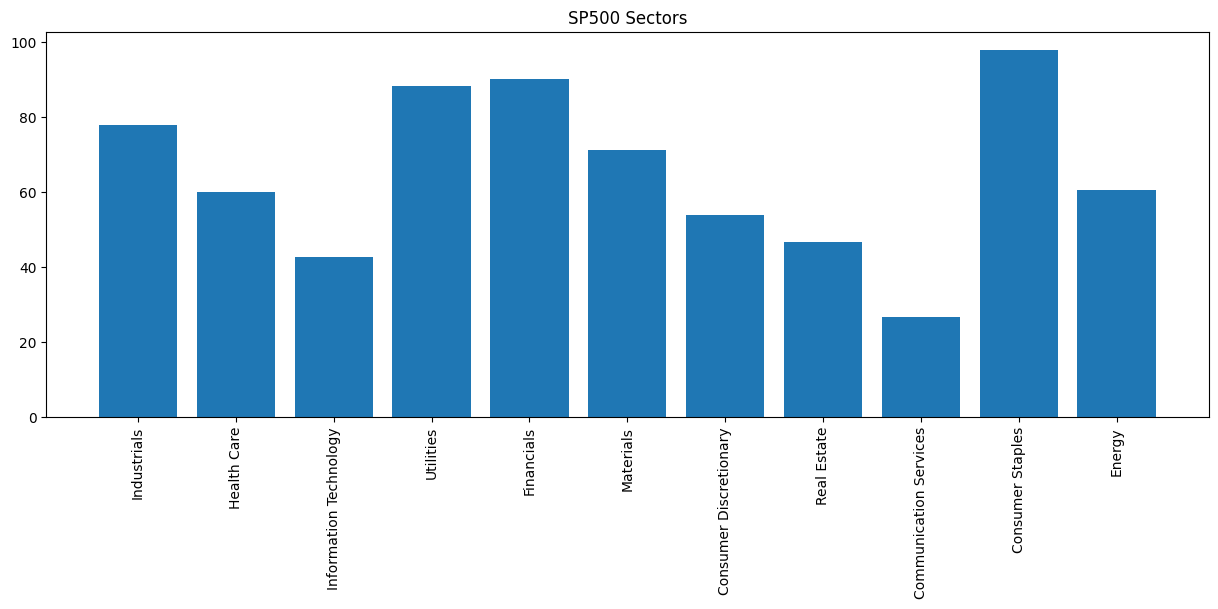
sector_age_mean_list = [np.mean(ages) for ages in sector_age_dict.values()]
plt.figure(figsize=(15,5))
plt.title('SP500 Sectors')
plt.bar(sector_age_dict.keys(), sector_age_mean_list)
plt.xticks(rotation=90);
sorted_sector_age_mean_list = sector_age_mean_list.copy()
sorted_sector_age_mean_list
[77.83544303797468,
 59.9,
 42.8,
 88.3225806451613,
 90.06666666666666,
 71.1923076923077,
 53.795918367346935,
 46.645161290322584,
 26.782608695652176,
 97.8108108108108,
 60.54545454545455]
sorted_sector_age_mean_list.sort(reverse=True)
sorted_sector_age_mean_list
[97.8108108108108,
 90.06666666666666,
 88.3225806451613,
 77.83544303797468,
 71.1923076923077,
 60.54545454545455,
 59.9,
 53.795918367346935,
 46.645161290322584,
 42.8,
 26.782608695652176]
sorted_sector_age_list = []
for sorted_age_mean in sorted_sector_age_mean_list:
    for i in range(len(sector_age_mean_list)):
        if (sorted_age_mean == sector_age_mean_list[i]):
            sorted_sector_age_list.append(list(sector_age_dict.keys())[i])


sorted_sector_age_list
['Consumer Staples',
 'Financials',
 'Utilities',
 'Industrials',
 'Materials',
 'Energy',
 'Health Care',
 'Consumer Discretionary',
 'Real Estate',
 'Information Technology',
 'Communication Services']
plt.figure(figsize=(15,5))
plt.title('SP500 Sectors')
plt.bar(sorted_sector_age_list, sorted_sector_age_mean_list)
plt.xticks(rotation=90);