App: Seaborn Library#

The seaborn library enables for high-level visualization. It is commonly imported as:
import seaborn as sns
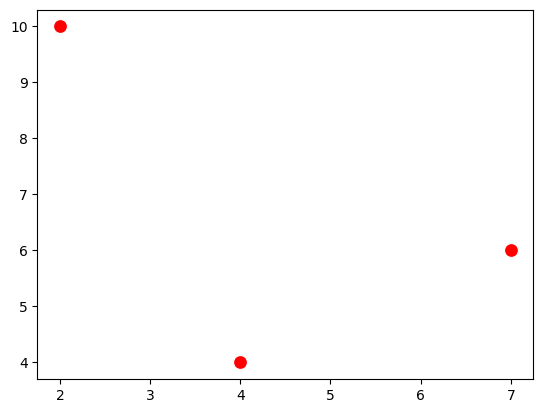
Scatterplot#
sns.scatterplot() is used to generate scatter plots. It shows points on a graph using dots.
sns.scatterplot(x=[2,4,7],y=[10,4,6], color='r', s=100);
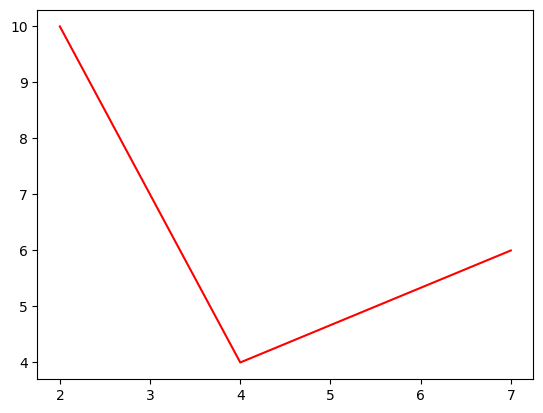
Lineplot#
sns.lineplot() is used to generate line plots.
sns.lineplot(x=[2,4,7],y=[10,4,6], color='r');
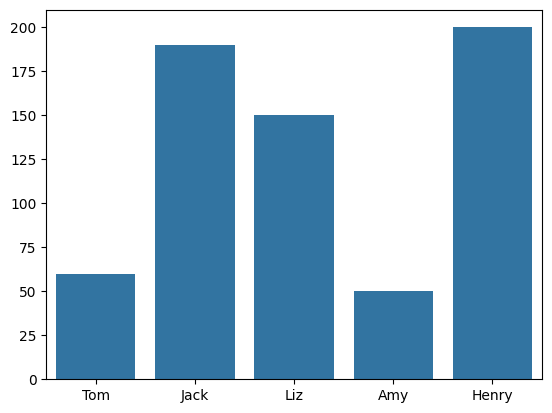
Barplot#
sns.bar() is used to generate bar plots.
sns.barplot(x=['Tom', 'Jack', 'Liz', 'Amy', 'Henry'], y=[60, 190,150, 50, 200]);
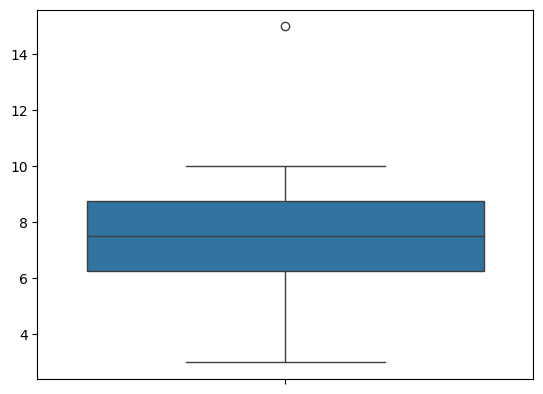
Box Plot#
The boxplot displays the minimum, 25th percentile, median, 75th percentile, maximum, and outliers of a dataset.
sns.boxplot([8,7,3,4,8,9,6,7,10,15]);
Displot#
sns.displot()is used to generate histograms.
sns.displot([8,7,3,2,1,5,6,7,8,1,3,2,5]);
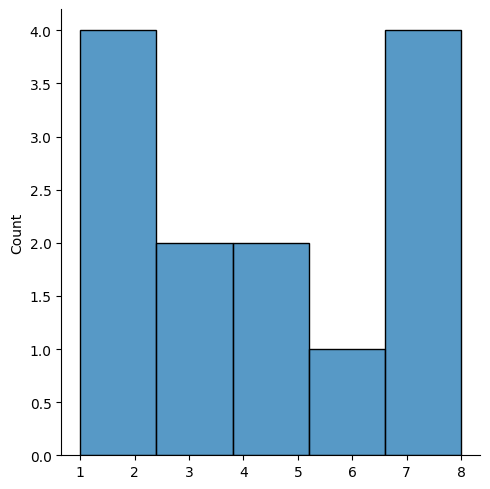
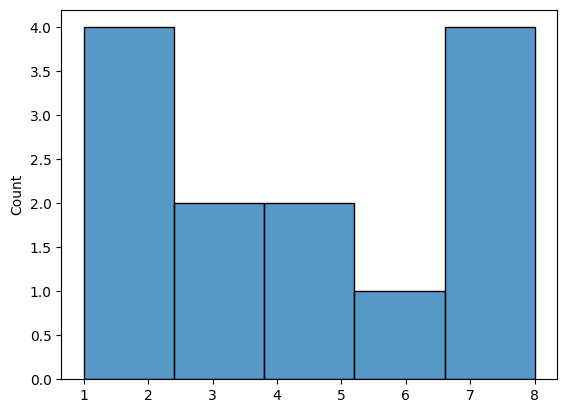
Histplot#
sns.histplot() is used to generate histograms.
sns.histplot([8,7,3,2,1,5,6,7,8,1,3,2,5]);