Project: Grading System#
In this project, a dataset containing randomly selected student names, grade levels, and scores from various tests is used. A weighted total grade is calculated, and corresponding letter grades are assigned. Additionally, grade analysis is performed using the prepared data.
import string
import random
import seaborn as sns
import matplotlib.pyplot as plt
import numpy as np
lower_case_letters = string.ascii_lowercase
upper_case_letters = string.ascii_uppercase
digits = string.digits
punctuations = string.punctuation
# number of students
number_students = 100
Names#
Generate a list of names using random characters with lengths of 3, 4, 5, or 6 characters.
random.seed(0)

names = []
for i in range(number_students):
    length_name = random.choice(range(3,7))
    name = ''
    for i in range(length_name):
        name += random.choice(lower_case_letters)
    names.append(name.capitalize())

names[:5]
['Ynbiqp', 'Zjplsg', 'Jeyd', 'Rwzte', 'Dxcvk']
Grades#
Generate a list of randomly assigned grade levels for each student.
random.seed(0)
grade_list = [9,10,11,12]
grades = [random.choice(grade_list)  for i in range(number_students)]
grades[:10]
[12, 12, 9, 11, 12, 12, 11, 12, 11, 10]
Test Scores#
Generate lists of randomly assigned grades for each student across five exams: Test1, Test2, Test3, Test4, and Final.
Test grades are randomly chosen from a normal (Gaussian) distribution with a specified mean (mu) and standard deviation (sigma).
random.gauss(mu=70, sigma=5)
72.15905718422292
random.seed(0)
test1 = [int(random.gauss(mu=80, sigma=15))  for i in range(number_students) ]
test2 = [int(random.gauss(mu=75, sigma=15))  for i in range(number_students) ]
test3 = [int(random.gauss(mu=80, sigma=10))  for i in range(number_students) ]
test4 = [int(random.gauss(mu=70, sigma=20))  for i in range(number_students) ]
final = [int(random.gauss(mu=70, sigma=20))  for i in range(number_students) ]
exam_list = [test1, test2, test3, test4, final]
exam_names = ['test1', 'test2', 'test3', 'test4', 'final']
To generate the exam names, the globals() dictionary, which contains all global variable name-value pairs, can be used instead of manually specifying each test name, as shown in the code above.
type(globals())
dict
globals().keys()
dict_keys(['__name__', '__doc__', '__package__', '__loader__', '__spec__', '__builtin__', '__builtins__', '_ih', '_oh', '_dh', 'In', 'Out', 'get_ipython', 'exit', 'quit', 'open', '_', '__', '___', '_i', '_ii', '_iii', '_i1', 'string', 'random', 'sns', 'plt', 'np', '_i2', 'lower_case_letters', 'upper_case_letters', 'digits', 'punctuations', '_i3', 'number_students', '_i4', 'names', 'i', 'length_name', 'name', '_4', '_i5', 'grade_list', 'grades', '_5', '_i6', '_6', '_i7', 'test1', 'test2', 'test3', 'test4', 'final', '_i8', 'exam_list', 'exam_names', '_i9', '_9', '_i10'])
exam_names = []
for exam in exam_list:
    exam_names.append([name for name in globals() if globals()[name] == exam][0])
exam_names
['test1', 'test2', 'test3', 'test4', 'final']
Let’s award extra points to higher grade levels, as they are expected to have more knowledge compared to lower grade levels.
for exam in exam_list:
    for i in range(number_students):
        exam[i] += (grades[i] - 9)*3
for exam in exam_list:
    print(f'Exam: {[name for name in globals() if globals()[name] == exam][0]}    Maximum: {max(exam):<5}   Minimum: {min(exam):<5}')
Exam: test1    Maximum: 125     Minimum: 50
Exam: test2    Maximum: 115     Minimum: 40
Exam: test3    Maximum: 118     Minimum: 56
Exam: test4    Maximum: 122     Minimum: 29
Exam: final    Maximum: 123     Minimum: 27
Since some of the grades exceed 100, we will cap them at 100.
for exam in exam_list:
    for score in exam:
        if score > 100:
            exam.insert(exam.index(score), 100)
            exam.remove(score)
        if score < 0:
            exam.insert(exam.index(score), 0)
            exam.remove(score)
Let’s check the maximum and minimum grades.
for exam in exam_list:
    print(f'Exam: {[name for name in globals() if globals()[name] == exam][0]}    Maximum: {max(exam):<5}   Minimum: {min(exam):<5}')
Exam: test1    Maximum: 100     Minimum: 50
Exam: test2    Maximum: 100     Minimum: 40
Exam: test3    Maximum: 100     Minimum: 56
Exam: test4    Maximum: 100     Minimum: 29
Exam: final    Maximum: 100     Minimum: 27
Weighted Score#
The weighted total grade is calculated using the following weights:
15% each for Test 1, Test 2, Test 3, and Test 4, and 40% for the Final exam.
weighted_scores = [ 0.15*(test1[i]+test2[i]+test3[i]+test4[i])+0.40*final[i] for i in range(number_students)]
Final Letter Grades#
Final letters are determined usuing the following scale:
Weighted Score |
Letter Grade |
|---|---|
weighted_scores \(\ge\) 90 |
A |
90 > weighted_scores \(\ge\) 80 |
B |
80 > weighted_scores \(\ge\) 70 |
C |
70 > weighted_scores \(\ge\) 60 |
D |
60 > weighted_scores |
F |
letter_grades = []
for i in range(number_students):
    if weighted_scores[i] >= 90: letter_grades.append('A')
    elif weighted_scores[i] >= 80: letter_grades.append('B')
    elif weighted_scores[i] >= 70: letter_grades.append('C')
    elif weighted_scores[i] >= 60: letter_grades.append('D')
    else: letter_grades.append('F')

letter_grades[:10]
['B', 'D', 'C', 'B', 'C', 'B', 'A', 'B', 'B', 'C']
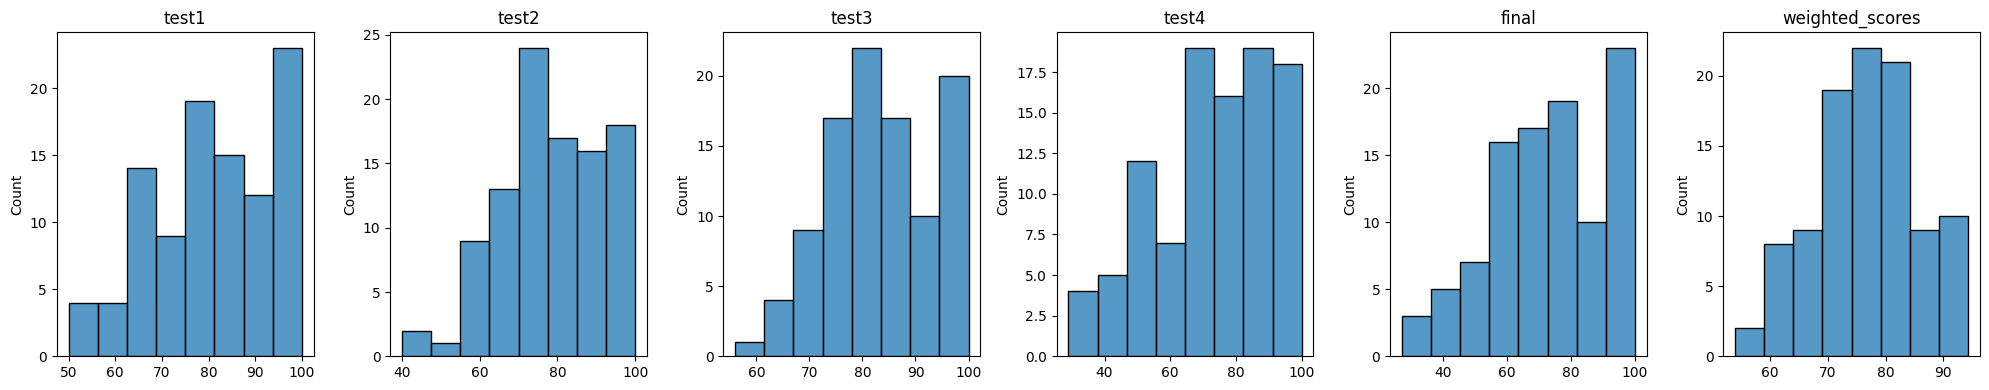
Histogram#
The histogram provides a visual representation of the distribution of the values, allowing us to observe patterns such as the concentration, spread, and frequency of data within different ranges.
plt.figure(figsize=(20,4))
for i in range(1,6):
    plt.subplot(1,6,i)
    plt.title(exam_names[i-1])
    sns.histplot(exam_list[i-1])
    plt.tight_layout()


plt.subplot(1,6,6)
plt.title('weighted_scores')
sns.histplot(weighted_scores);
Drop Lowest Test Score#
The lowest test grade is dropped, and only the best three test scores are considered, each weighted at 20%.
Create a dictionary where each name is paired with the list of the corresponding exam grades.
student_dict = {}
for i in range(number_students):
    student_dict[names[i]] = [test1[i], test2[i], test3[i], test4[i], final[i]]
for name in list(student_dict.keys())[:5]:
    print(f'{name:<7}  {student_dict[name]}')
Ynbiqp   [100, 64, 81, 100, 87]
Zjplsg   [68, 62, 91, 51, 51]
Jeyd     [69, 76, 86, 56, 82]
Rwzte    [91, 100, 96, 62, 76]
Dxcvk    [73, 91, 76, 100, 63]
Remove the lowest test grade from the list using the remove() method.
for i in range(number_students):
    student_dict[names[i]].remove(min(student_dict[names[i]][:-1]))
for name in list(student_dict.keys())[:5]:
    print(f'{name:<7}  {student_dict[name]}')
Ynbiqp   [100, 81, 100, 87]
Zjplsg   [68, 62, 91, 51]
Jeyd     [69, 76, 86, 82]
Rwzte    [91, 100, 96, 76]
Dxcvk    [91, 76, 100, 63]
Weighted Scores-2#
weighted_scores_2 = []
for grade in student_dict.values():
    weighted_scores_2.append(0.20*(grade[0]+grade[1]+grade[2])+0.40*grade[3])
Final Letter Grades-2#
letter_grades_2 = []
for i in range(number_students):
    if weighted_scores_2[i] >= 90: letter_grades_2.append('A')
    elif weighted_scores_2[i] >= 80: letter_grades_2.append('B')
    elif weighted_scores_2[i] >= 70: letter_grades_2.append('C')
    elif weighted_scores_2[i] >= 60: letter_grades_2.append('D')
    else: letter_grades_2.append('F')

letter_grades_2[:10]
['A', 'D', 'C', 'B', 'C', 'B', 'A', 'B', 'B', 'C']
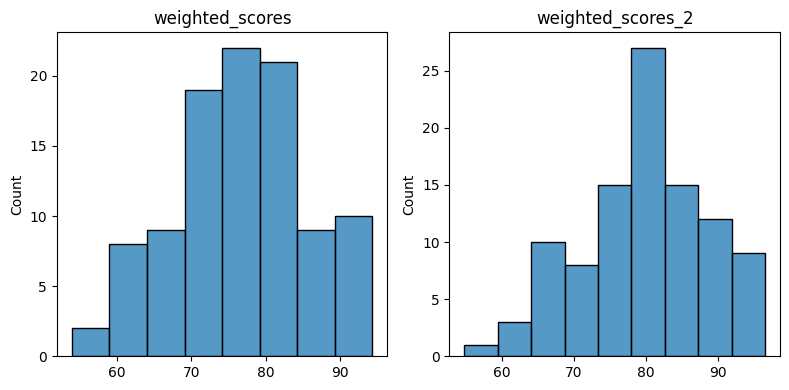
Histogram#
A comparison of histograms showing the distribution of weighted scores before and after dropping lowest test scores.
plt.figure(figsize=(8,4))
plt.subplot(1,2,1)
plt.title('weighted_scores')
sns.histplot(weighted_scores)
plt.subplot(1,2,2)
plt.title('weighted_scores_2')
sns.histplot(weighted_scores_2)
plt.tight_layout();
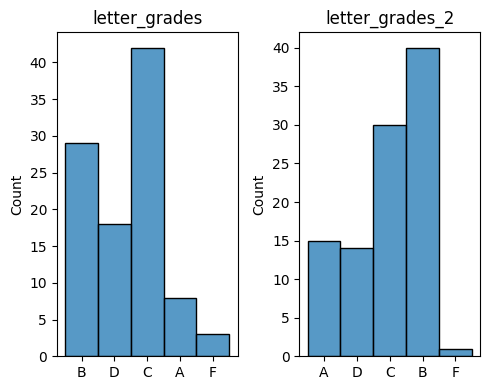
A comparison of histograms showing the distribution of letter grades before and after dropping lowest test scores.
plt.figure(figsize=(5,4))
plt.subplot(1,2,1)
plt.title('letter_grades')
sns.histplot(letter_grades)
plt.subplot(1,2,2)
plt.title('letter_grades_2')
sns.histplot(letter_grades_2)
plt.tight_layout();
Grade Analysis#
Create a dictionary where each grade level maps to a dictionary of test grades.
grade_dict={i:{j:[] for j in exam_names} for i in grade_list}

for i in range(number_students):
    for j in range(len(exam_names)):
        grade_dict[grades[i]][exam_names[j]].append(exam_list[j][i])
grade_dict.keys()
dict_keys([9, 10, 11, 12])
grade_dict[9].keys()
dict_keys(['test1', 'test2', 'test3', 'test4', 'final'])
The number of students at each grade level who took the tests.
for grade, exam_scores in grade_dict.items():
    print(f'Grade: {grade:<2}', end=' ')
    for exam, score in  exam_scores.items():
        print(f'{exam}:{len(score)}', end=' ')
    print()
Grade: 9  test1:26 test2:26 test3:26 test4:26 final:26
Grade: 10 test1:24 test2:24 test3:24 test4:24 final:24
Grade: 11 test1:28 test2:28 test3:28 test4:28 final:28
Grade: 12 test1:22 test2:22 test3:22 test4:22 final:22
Grade Based#
For each grade level, calculate and display the mean score for each exam.
for grade in grade_dict:
    for exam in exam_names:
        print(f'Grade: {grade:<10} {exam} Mean: {np.mean(grade_dict[grade][exam]):.2f} ')
    print('-'*40)
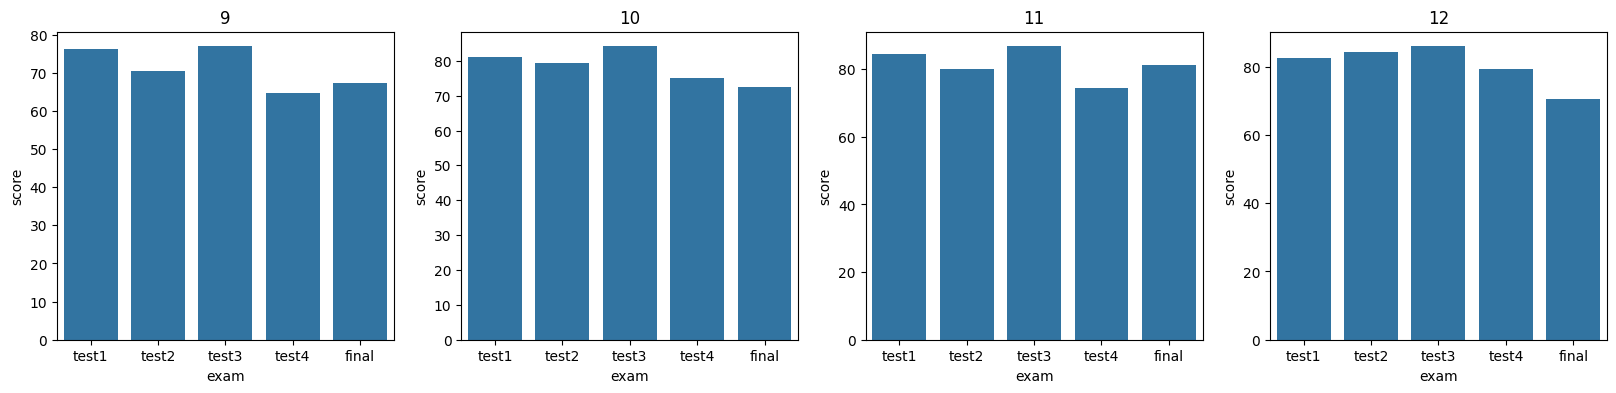
Grade: 9          test1 Mean: 76.27
Grade: 9          test2 Mean: 70.50
Grade: 9          test3 Mean: 76.88
Grade: 9          test4 Mean: 64.62
Grade: 9          final Mean: 67.23
----------------------------------------
Grade: 10         test1 Mean: 81.08
Grade: 10         test2 Mean: 79.25
Grade: 10         test3 Mean: 84.12
Grade: 10         test4 Mean: 75.00
Grade: 10         final Mean: 72.58
----------------------------------------
Grade: 11         test1 Mean: 84.64
Grade: 11         test2 Mean: 79.93
Grade: 11         test3 Mean: 86.75
Grade: 11         test4 Mean: 74.39
Grade: 11         final Mean: 81.25
----------------------------------------
Grade: 12         test1 Mean: 82.55
Grade: 12         test2 Mean: 84.32
Grade: 12         test3 Mean: 85.95
Grade: 12         test4 Mean: 79.36
Grade: 12         final Mean: 70.64
----------------------------------------
Create a bar plot showing the mean scores of all exams for each grade level.
plt.figure(figsize=(20,4))
k = 1
for grade in grade_list:
    plt.subplot(1,4,k)
    sns.barplot(x=exam_names, y=[np.mean(grade_dict[grade][exam]) for exam in exam_names])
    plt.title(grade)
    plt.xlabel('exam')
    plt.ylabel('score')
    k += 1
Exam Based#
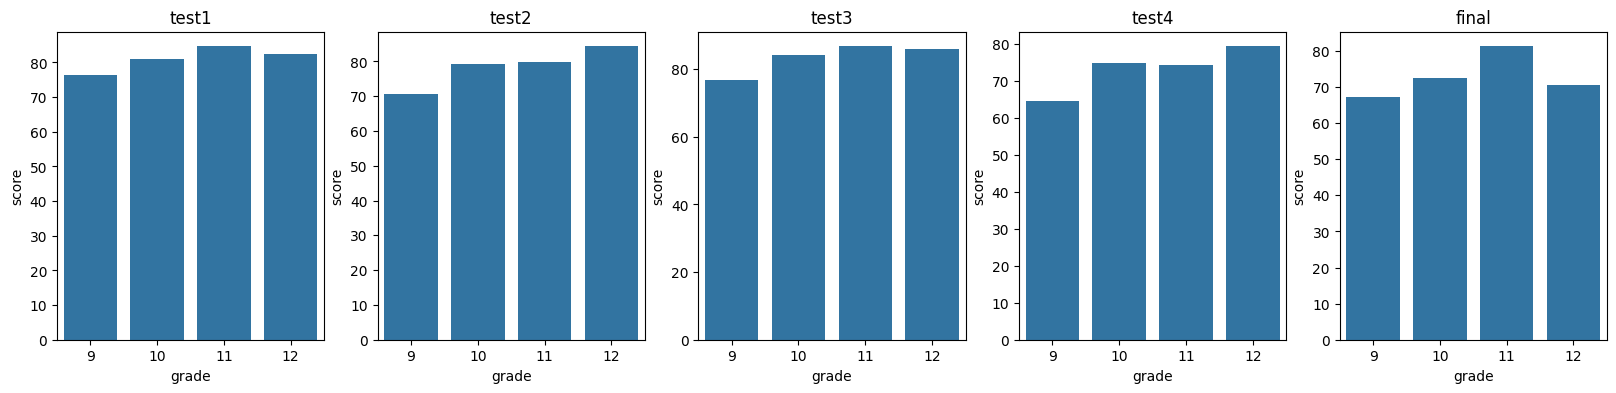
For each exam, calculate and display the mean score for each grade level.
for exam in exam_names:
    for grade in grade_dict:
        print(f'Grade: {grade:<5} {exam} Mean: {np.mean(grade_dict[grade][exam]):.2f} ')
    print('-'*40)
Grade: 9     test1 Mean: 76.27
Grade: 10    test1 Mean: 81.08
Grade: 11    test1 Mean: 84.64
Grade: 12    test1 Mean: 82.55
----------------------------------------
Grade: 9     test2 Mean: 70.50
Grade: 10    test2 Mean: 79.25
Grade: 11    test2 Mean: 79.93
Grade: 12    test2 Mean: 84.32
----------------------------------------
Grade: 9     test3 Mean: 76.88
Grade: 10    test3 Mean: 84.12
Grade: 11    test3 Mean: 86.75
Grade: 12    test3 Mean: 85.95
----------------------------------------
Grade: 9     test4 Mean: 64.62
Grade: 10    test4 Mean: 75.00
Grade: 11    test4 Mean: 74.39
Grade: 12    test4 Mean: 79.36
----------------------------------------
Grade: 9     final Mean: 67.23
Grade: 10    final Mean: 72.58
Grade: 11    final Mean: 81.25
Grade: 12    final Mean: 70.64
----------------------------------------
Create a bar plot showing the mean scores of each exam for each grade level.
plt.figure(figsize=(20,4))
k = 1
for exam in exam_names:
    plt.subplot(1,5,k)
    sns.barplot(x=grade_list, y=[np.mean(grade_dict[grade][exam]) for grade in grade_list])
    plt.title(exam)
    plt.xlabel('grade')
    plt.ylabel('score')
    k += 1
Future Work#
Use different distributions to randomly generate exam grades, ensuring that the distributions vary for different grade levels. Additionally, employ various visualization tools to analyze the data.