Lists Business#

Business Applications#
Question-1: Max of Revenue#
Revenue (R) is the product of the number (n) of items sold and the price (p) of the item.
\(R = p\cdot n\)
The number of item sold is given by the following equation: \(n = -1.5p+30\)
Construct a list that consists of the revenues for \(0\le p \le 20\).
Plot the graph of revenue for \(0\le p \le 20\)
Question-2: Profit#
Profit (P) is the difference between Revenue and Cost
\(Profit = Revenue - Cost\)
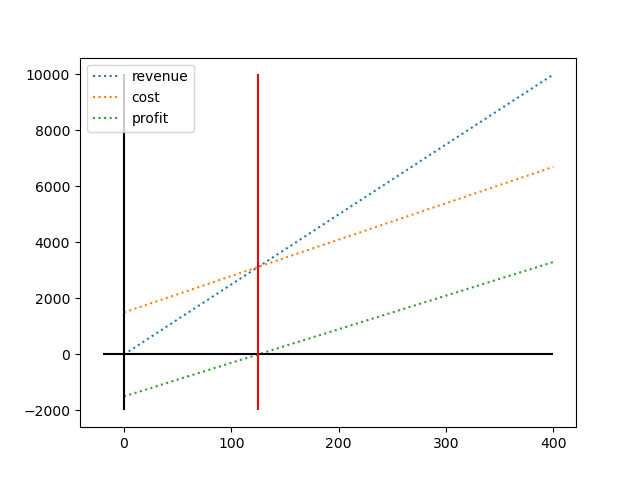
The monthly fixed cost of a cable factory is 1500 dollars. Each cable costs 13 dollars and sells for 25 dollars.
For what number of cables produced profit is zero.
Hint: Calculate the profit for \(n\) between 1 and 400.
Construct three lists that consist of the revenues, costs, and profits for \(0\le p \le 400\).
Plot the reveue, cost, profit for producing up to 400 cables.
Draw a vertical line where the profit is zero for \(n\).
Sample Plot:
Question-3: Break-Even Point#
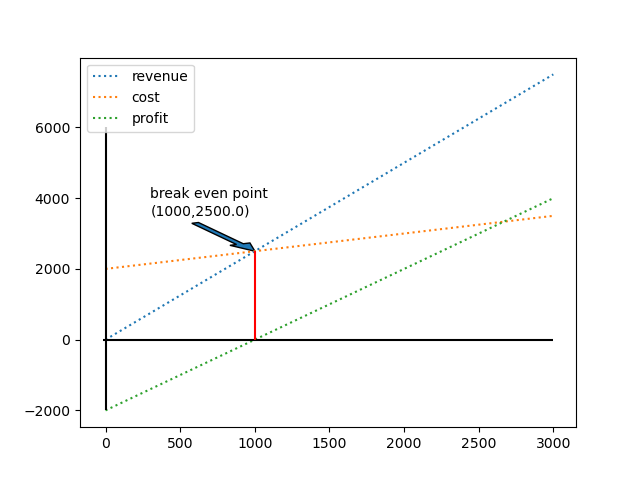
Break-Even Point is the point where total cost equals total revenue, meaning profit is zero.
For the given cost and the revenue functions find the break-even point and plot it.
\(C(n) = 0.5n +2000\)
\(R(n) = 2.5n\)
Hint: Calculate the cost and revenue for n between 1 and 10,000.
Sample Plot:
Question-4: Exponential Depreciation#
The value \(V\) of a truck in dollars is given by the formula \(V(t)=140000(1.35)^{-0.6t}\) where \(t\) is the age of the truck in years.
Plot the graph of values of the truck in 30 years.
Question-5: Demand#
If the demand function is given as the following linear relation \(p = -2q+300\).
Plot the demand function for \(1\le q\le 200\).
Question-6: Supply Function#
If the supply function is given by the linear relation \(p = 4q+100\).
Plot the supply function for \(1\le q\le 100\).
Question-7: Equilibrium Point#
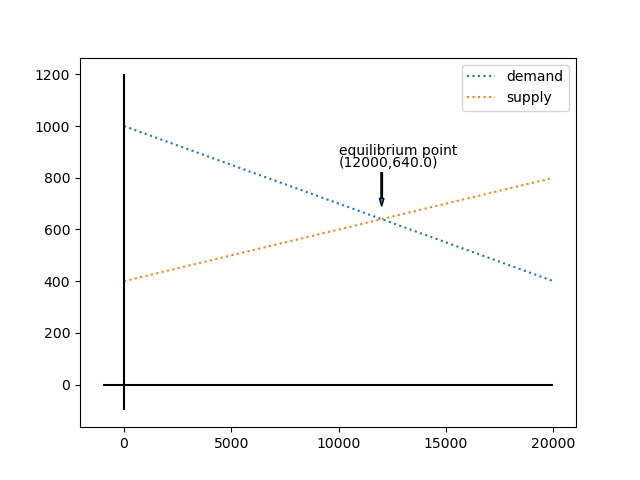
An equilibrium point is where the demand and supply curves intersect.
For the given demand and the supply functions find the equilibrium point and plot it.
Demand: \(p(q) = -0.03q + 1000\)
Supply: \(p(q) = 0.02q + 400\)
Hint: Calculate the demand and supply for \(q\) between 0 and 20,000.
Sample plot:
Question-8: Stock Percentage Changes#
The following is a list of the prices for Tesla stock over a certain period of time.
stock_prices = [174.9499969482422,
 186.60000610351562,
 180.11000061035156,
 173.74000549316406,
 179.24000549316406,
 176.75,
 176.19000244140625,
 178.7899932861328,
 178.0800018310547,
 176.2899932861328,
 174.77000427246094,
 175.0,
 177.94000244140625,
 177.47999572753906,
 173.7899932861328,
 170.66000366210938,
 177.2899932861328,
 182.47000122070312,
 178.00999450683594,
 187.44000244140625,
 184.86000061035156]
Create a list of percentage changes using the stock_prices list.
The first element of the percentage list is np.nan because there is no price available for the previous day.
Question-9: Stock Behavior#
The following is a list of the prices for Tesla stock over a certain period of time.
stock_prices = [174.9499969482422,
 186.60000610351562,
 180.11000061035156,
 173.74000549316406,
 179.24000549316406,
 176.75,
 176.19000244140625,
 178.7899932861328,
 178.0800018310547,
 176.2899932861328,
 174.77000427246094,
 175.0,
 177.94000244140625,
 177.47999572753906,
 173.7899932861328,
 170.66000366210938,
 177.2899932861328,
 182.47000122070312,
 178.00999450683594,
 187.44000244140625,
 184.86000061035156]
Create a list indicating the behavior of stock prices as Increasing, Decreasing, or Flat using the stock_prices list.
Count how many days the stock price went up.
The first element of the behavior list is np.nan because there is no price available for the previous day.