App: Statistics Module#

The statistics module provides most commonly used statistical functions.
First, you need to import the statistics module.
import statistics
You can access the list of methods in the statistics module by using the dir(statistics) function.
You can execute help(statistics) for more details.
print(dir(statistics))
['Counter', 'Decimal', 'Fraction', 'LinearRegression', 'NormalDist', 'StatisticsError', '_SQRT2', '__all__', '__annotations__', '__builtins__', '__cached__', '__doc__', '__file__', '__loader__', '__name__', '__package__', '__spec__', '_coerce', '_convert', '_decimal_sqrt_of_frac', '_exact_ratio', '_fail_neg', '_float_sqrt_of_frac', '_integer_sqrt_of_frac_rto', '_isfinite', '_mean_stdev', '_normal_dist_inv_cdf', '_sqrt_bit_width', '_ss', '_sum', 'bisect_left', 'bisect_right', 'correlation', 'covariance', 'defaultdict', 'erf', 'exp', 'fabs', 'fmean', 'fsum', 'geometric_mean', 'groupby', 'harmonic_mean', 'hypot', 'linear_regression', 'log', 'math', 'mean', 'median', 'median_grouped', 'median_high', 'median_low', 'mode', 'mul', 'multimode', 'namedtuple', 'numbers', 'pstdev', 'pvariance', 'quantiles', 'random', 'reduce', 'repeat', 'sqrt', 'stdev', 'sys', 'tau', 'variance']
Methods#
mean()#
It returns the mean (average) of the provided data.
data = [1,2,3,3,4,4,4,5,5,6]
print(statistics.mean(data))
3.7
median()#
It returns the median of the provided data.
data = [1,2,3,3,4,4,4,5,5,6]
print(statistics.median(data))
4.0
mode()#
It returns the mode (most frequent element) of the provided data.
data = [1,2,3,3,3,4,4,5,5,6]
print(statistics.mode(data))
3
pstdev()#
It returns the population standard deviation of the given data.
data = [1,2,3,3,3,4,4,5,5,6]
print(statistics.pstdev(data))
1.42828568570857
stdev()#
It returns the sample standard deviation of the given data.
data = [1,2,3,3,3,4,4,5,5,6]
print(statistics.stdev(data))
1.505545305418162
pvariance()#
It returns the population variation of the given data.
data = [1,2,3,3,3,4,4,5,5,6]
print(statistics.pvariance(data))
2.04
variance()#
It returns the sample variation of the given data.
data = [1,2,3,3,3,4,4,5,5,6]
print(statistics.variance(data))
2.2666666666666666
quantiles()#
It returns three points that divide the data into four intervals, each containing approximately 25 percent of the data.
The parameter n specifies the number of intervals, with a default value of 4.
data = [1,2,3,3,3,4,4,5,5,6]
print(statistics.quantiles(data))
[2.75, 3.5, 5.0]
data = [1,2,3,4,5,6,7,8,9,10]
print(statistics.quantiles(data))
[2.75, 5.5, 8.25]
correlation()#
It returns the Pearson’s correlation coefficient of two given data.
By default, it computes Pearson’s correlation coefficient, a value ranging between -1 and +1, indicating the strength and direction of a linear relationship between variables.
data1 = [1,2,3,3,3,4,4,5,5,6]
data2 = [4,3,3,2,2,2,3,3,3,1]
print('Pearson’s correlation       coefficient:', statistics.correlation(data1, data2))
Pearson’s correlation coefficient: -0.5776155346615539
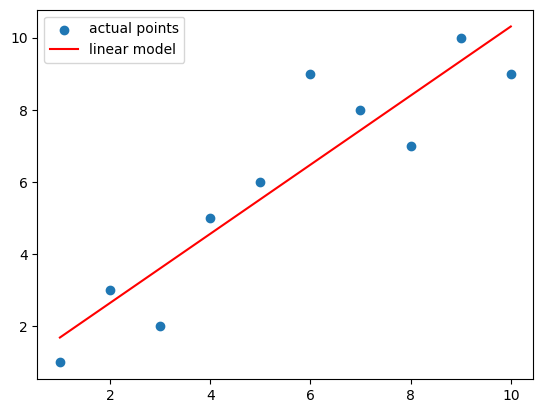
linear_regression()#
It returns and returns the slope and intercept of the linear regression model, representing the closest line to the scatter plot of the data.
x = [1,2,3,4,5,6,7,8,9,10]
y = [1,3,2,5,6,9,8,7,10,9]

model = statistics.linear_regression(x, y)
slope = model.slope
intercept = model.intercept
import matplotlib.pyplot as plt
plt.scatter(x,y, label='actual points')

x1, y1 = 1, 1*slope+intercept
x2, y2 = 10, 10*slope+intercept

plt.plot([x1, x2], [y1, y2], color='r', label='linear model')
plt.legend();
sqrt()#
It is the square root function. The syntax is statistics.sqrt()
statistics.sqrt(36)
6.0
log()#
It returns the logarithm of the given value to the specified base, which defaults to \(e\).
# log base e
statistics.log(1)
0.0
# log base 10
statistics.log(1000, 10)
2.9999999999999996
# log base 2
statistics.log(32, 2)
5.0