Unsupervised Learning#

No Output (Label): The algorithm works solely with input data without any labeled output.
Creates a New Data Representation:
Transforms the data into a more interpretable form compared to its original representation.
Aim: Discovering Hidden Structures
The primary goal is to uncover underlying structures or distributions within the data.
Tasks:
Clustering:
Divides the data into distinct groups of similar items.
Dimension Reduction:
Reduces the number of features while preserving the essential characteristics of the data.
Outlier Detection:
Identifies data points that deviate significantly from the rest of the data.
Examples:
Topic Extraction: Identifying themes or topics from a collection of text documents (e.g., reviews).
Organization of Pictures: Grouping images based on similarities.
DISADVANTAGE: No Success Metric
Since there are no labeled outputs, it’s challenging to measure the algorithm’s accuracy or success.
APPLICATIONS
Exploratory Data Analysis: Often used to gain a deeper understanding of the data.
Preprocessing: Serves as a preprocessing step for supervised learning algorithms.
Iris Data#
Consider only the first two features for visualizition purposes
from sklearn.datasets import load_iris
X, y = load_iris(return_X_y=True)
from sklearn.model_selection import train_test_split
X_train, X_test, y_train, y_test = train_test_split(X, y, random_state=42)
f_names = load_iris().feature_names
f_names
['sepal length (cm)',
 'sepal width (cm)',
 'petal length (cm)',
 'petal width (cm)']
t_names = load_iris().target_names
t_names
array(['setosa', 'versicolor', 'virginica'], dtype='<U10')
# Iris in Supervised Learning
import matplotlib.pyplot as plt
import seaborn as sns
plt.title('Iris in Supervised Learning')
sns.scatterplot( x=X_train[:,0], y=X_train[:,1], hue=y_train, palette='bright' )
plt.xlabel(f_names[0])
plt.ylabel(f_names[1]);

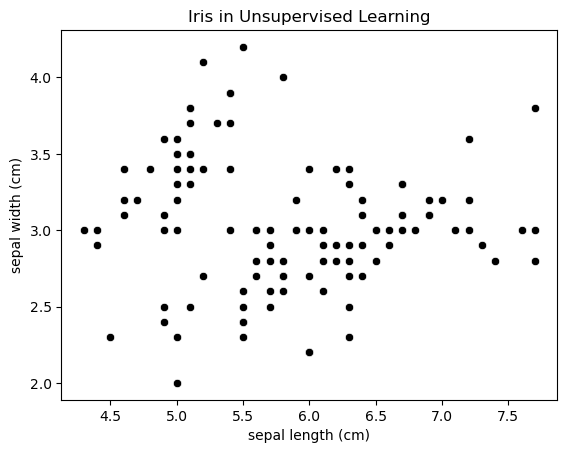
# Iris in Unsupervised Learning
plt.title('Iris in Unsupervised Learning')
train_targets_iris = [t_names[i] for i in y_train]
sns.scatterplot( x=X_train[:,0], y=X_train[:,1], color='black')
plt.xlabel(f_names[0])
plt.ylabel(f_names[1]);