Polynomial Regression#

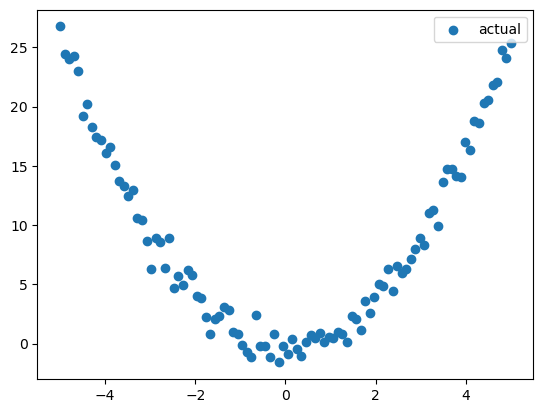
Toy Data#
import numpy as np
import matplotlib.pyplot as plt
np.random.seed(0)

N = 100
X = np.linspace(-5,5,N)
noise = np.random.randn(N)
y = X**2+noise

plt.scatter(X, y, label='actual')
plt.legend();
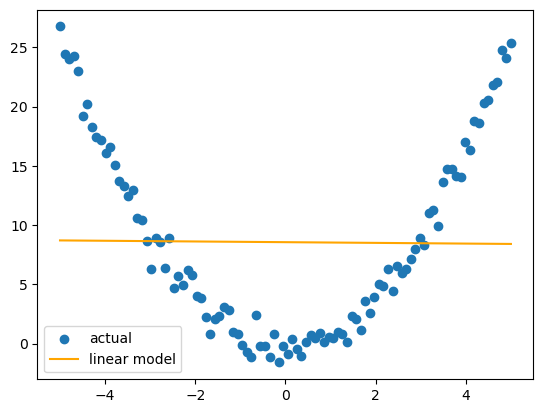
Linear Regression#
from sklearn.linear_model import LinearRegression
lin_reg = LinearRegression()
lin_reg.fit(X.reshape(-1,1), y)
y_l = lin_reg.predict(X.reshape(-1,1))

plt.scatter(X, y, label='actual')
plt.plot(X, y_l, label='linear model', c='orange')
plt.legend();
Polynomial Features#
from sklearn.preprocessing import PolynomialFeatures

poly = PolynomialFeatures(degree=2, include_bias=False)

poly.fit(X.reshape(-1,1))

poly.get_feature_names_out()
array(['x0', 'x0^2'], dtype=object)
X_poly = poly.transform(X.reshape(-1,1))

X_poly.shape
(100, 2)
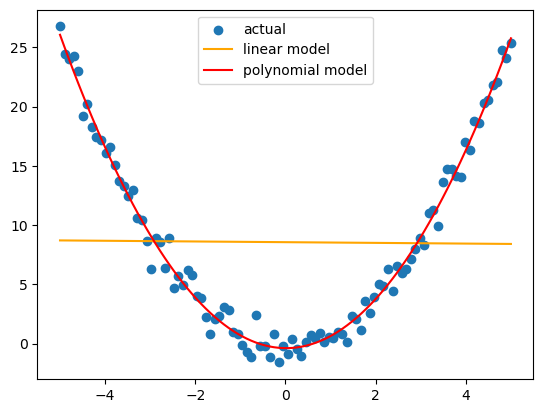
Polynomial Regression#
lin_reg = LinearRegression()
lin_reg.fit(X_poly, y)
y_poly = lin_reg.predict(X_poly)

plt.scatter(X, y, label='actual')
plt.plot(X, y_l, label='linear model', c='orange')
plt.plot(X, y_poly, label='polynomial model', c='r')

plt.legend();
California Housing Data#
from sklearn.datasets import fetch_california_housing
X, y = fetch_california_housing(return_X_y=True)
from sklearn.model_selection import train_test_split
X_train, X_test, y_train, y_test = train_test_split(X, y, random_state=0)
poly = PolynomialFeatures(degree=2, include_bias=False)

poly.fit(X_train)

poly.get_feature_names_out()
array(['x0', 'x1', 'x2', 'x3', 'x4', 'x5', 'x6', 'x7', 'x0^2', 'x0 x1',
       'x0 x2', 'x0 x3', 'x0 x4', 'x0 x5', 'x0 x6', 'x0 x7', 'x1^2',
       'x1 x2', 'x1 x3', 'x1 x4', 'x1 x5', 'x1 x6', 'x1 x7', 'x2^2',
       'x2 x3', 'x2 x4', 'x2 x5', 'x2 x6', 'x2 x7', 'x3^2', 'x3 x4',
       'x3 x5', 'x3 x6', 'x3 x7', 'x4^2', 'x4 x5', 'x4 x6', 'x4 x7',
       'x5^2', 'x5 x6', 'x5 x7', 'x6^2', 'x6 x7', 'x7^2'], dtype=object)
X_train_poly = poly.transform(X_train)
X_test_poly = poly.transform(X_test)

X_train_poly.shape, X_test_poly.shape
((15480, 44), (5160, 44))
lin_reg = LinearRegression()
lin_reg.fit(X_train_poly, y_train)
LinearRegression()In a Jupyter environment, please rerun this cell to show the HTML representation or trust the notebook.
On GitHub, the HTML representation is unable to render, please try loading this page with nbviewer.org.
LinearRegression()
lin_reg.score(X_train_poly, y_train)
0.685934216623096
lin_reg.score(X_test_poly, y_test)
-0.7296138933574114