kNN#

k-nearest neighbors (kNN) is one of the simplest machine learning algorithms. The core concept of kNN involves selecting the closest samples (nearest neighbors) and making predictions based on the values of these nearest neighbors.
The number of nearest neighbors is specified by the n_neighbors parameter. For example, if n_neighbors is set to 5, the prediction for a sample is based on the 5 nearest samples.
kNN can be used for both classification and regression tasks.
For classification, the most common class among the 5 nearest samples is selected as the predicted class.
For regression, the predicted value is the mean of the outputs from these 5 nearest samples.
KNeighborsClassifier#
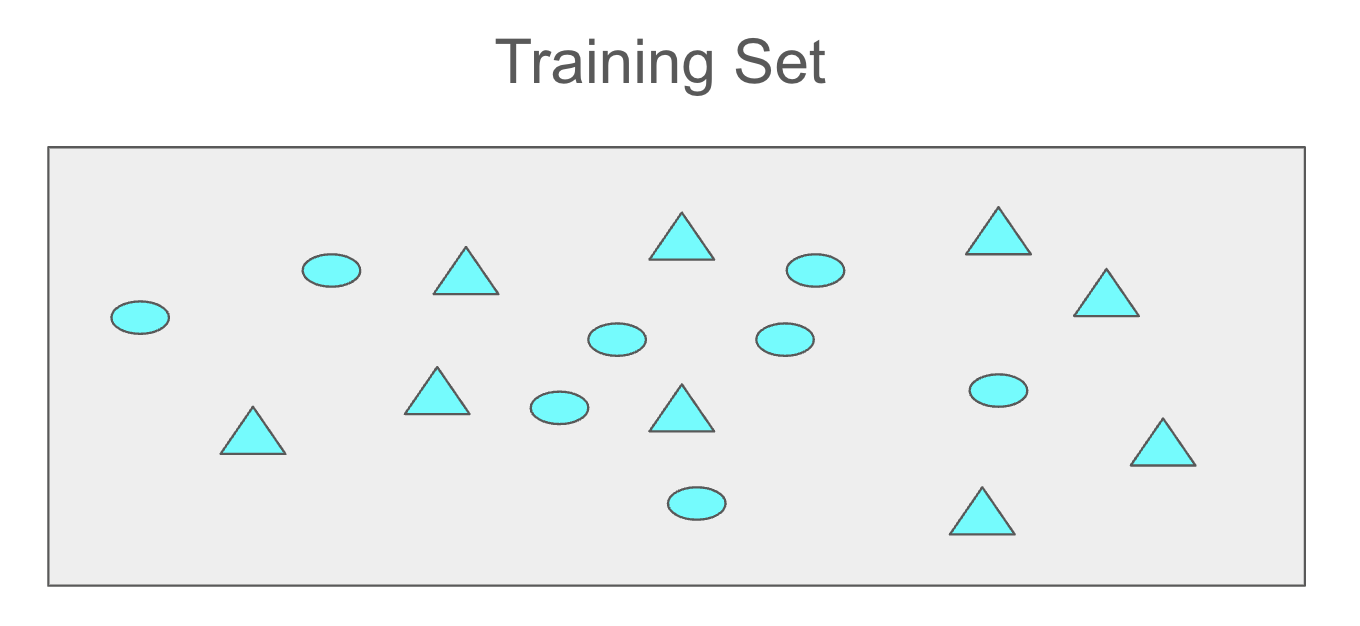
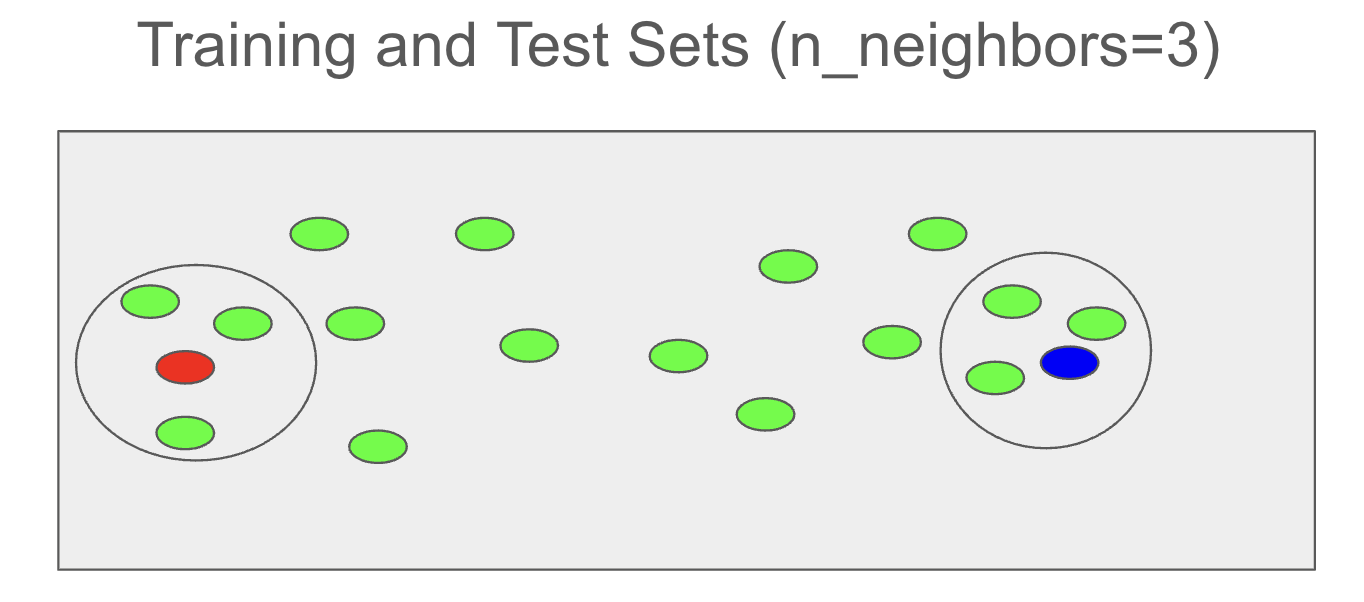
The following training set consists of two classes: circles and triangles.
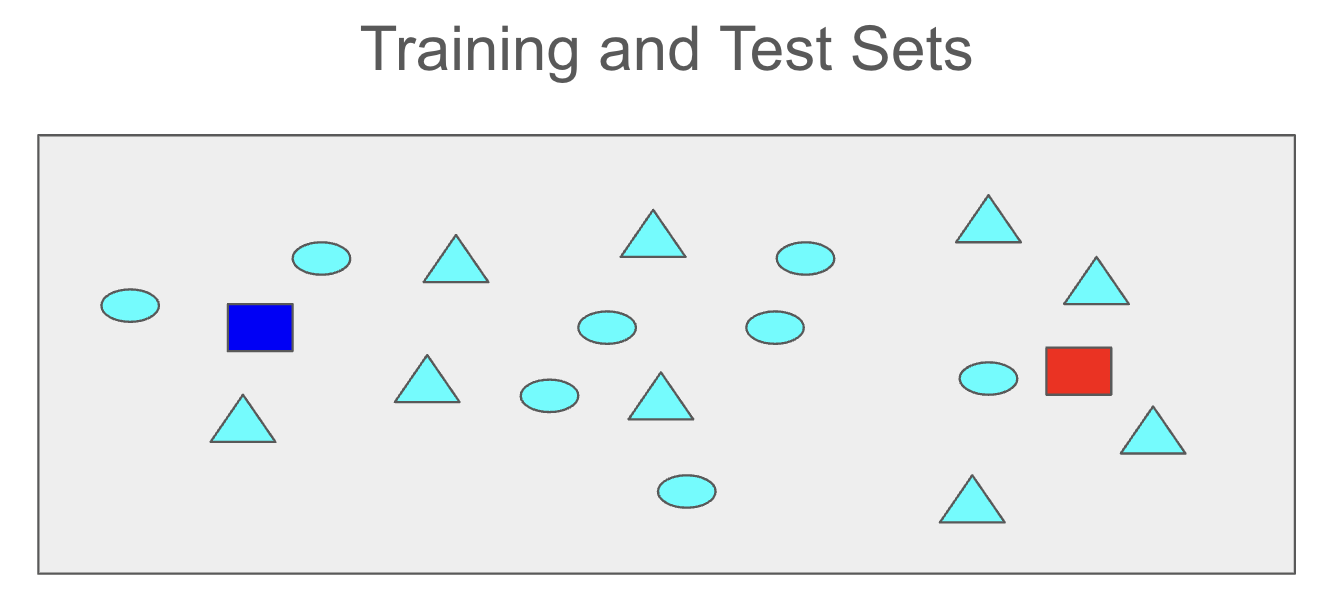
The blue and red rectangles represent two test samples, and their classes (circle or triangle) will be predicted using the kNN algorithm.
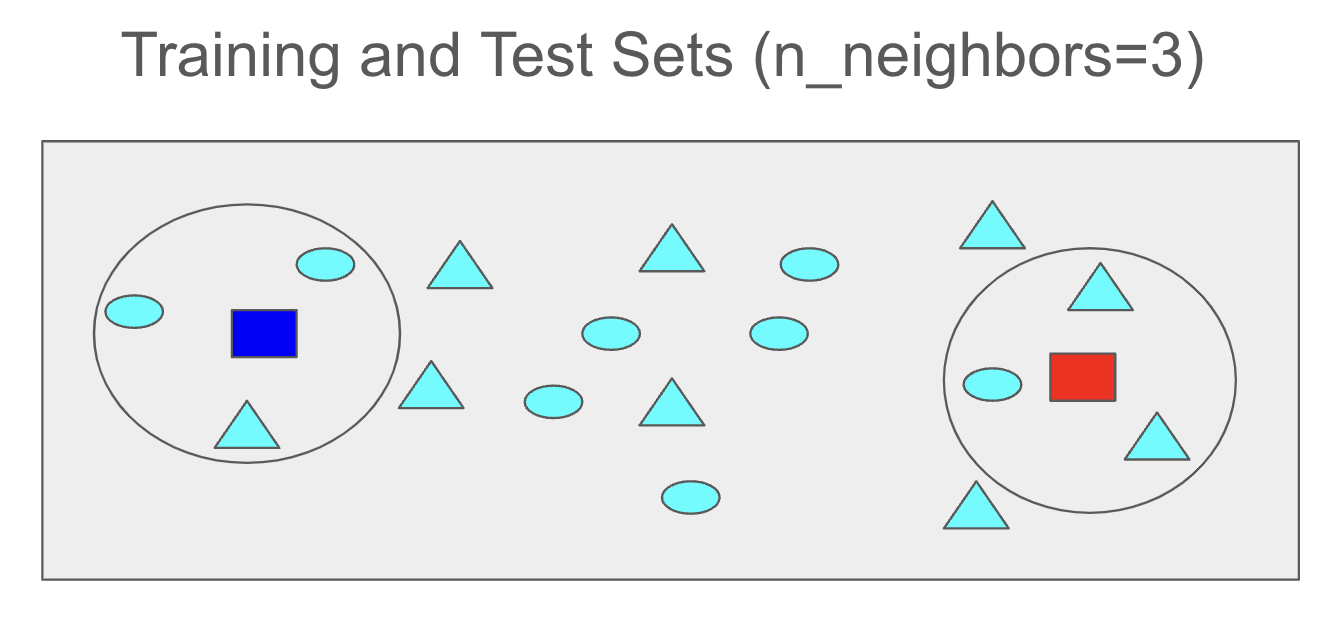
If the n_neighbors parameter is set to 3, the three closest samples from the training set will be identified for each blue and red test sample.
For the test sample represented by the red rectangle, two triangles and one circle are the closest training samples. Therefore, the class of this red test sample is predicted to be a triangle.
For the test sample represented by the blue rectangle, two circles and one triangle are the closest training samples. Therefore, the class of this blue test sample is predicted to be a circle.
If the n_neighbors parameter is set to 5, the five closest samples from the training set will be identified for each blue and red test sample.
For the test sample represented by the red rectangle, four triangles and one circle are the closest training samples. Therefore, the class of this red test sample is predicted to be a triangle.
For the test sample represented by the blue rectangle, two circles and three triangles are the closest training samples. Therefore, the class of this blue test sample is predicted to be a triangle.
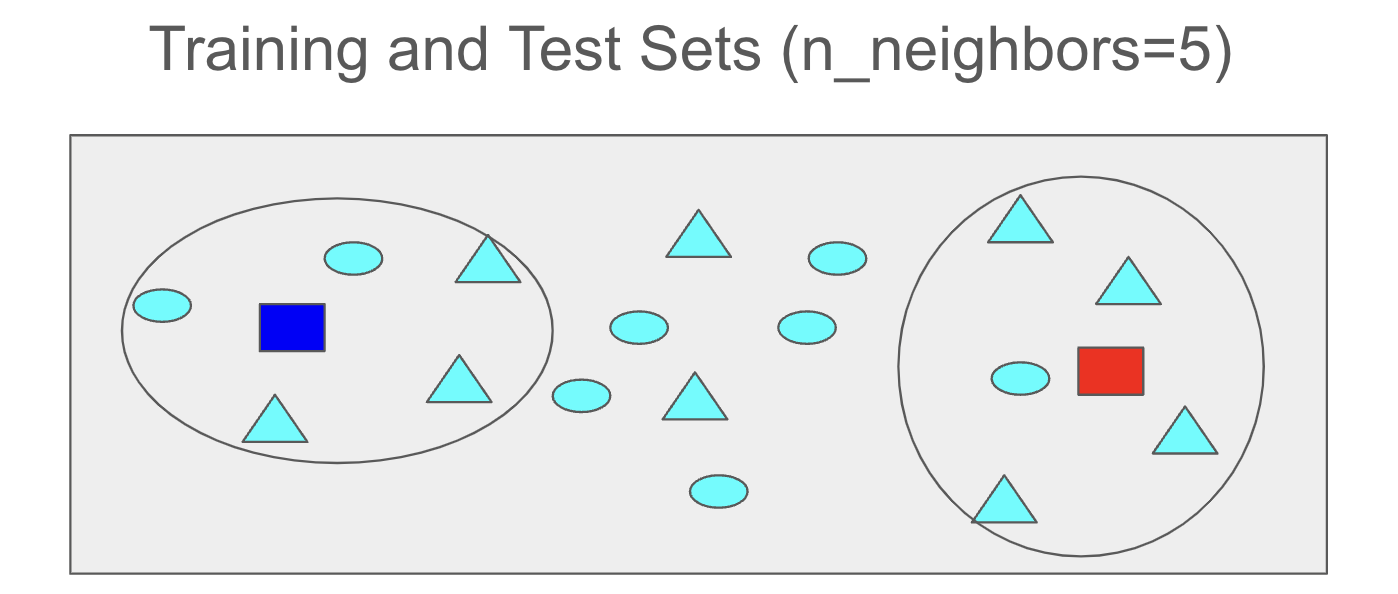
Note that the predicted class for the red test sample remains a triangle in both cases. However, the predicted class of the blue test sample changes from circle to triangle when the n_neighbors parameter is adjusted from 3 to 5.
You can explore further details in the KNeighborsClassifier Official Documentation.
Data#
from sklearn.datasets import load_breast_cancer
X, y = load_breast_cancer(return_X_y=True)
print(f'Input Shape: {X.shape}  ------  Output Shape: {y.shape}')
Input Shape: (569, 30) ------ Output Shape: (569,)
from sklearn.model_selection import train_test_split
X_train, X_test, y_train, y_test = train_test_split(X, y, random_state=0)
print(f'Training Input Shape: {X_train.shape}  ------  Training Output Shape: {y_train.shape}')
print(f'Test     Input Shape: {X_test.shape}  ------  Test Output Shape     : {y_train.shape}')
Training Input Shape: (426, 30)  ------  Training Output Shape: (426,)
Test     Input Shape: (143, 30)  ------  Test Output Shape     : (426,)
Coding#
KNeighborsClassifier class is imported from the neighbors module of sklearn.
from sklearn.neighbors import KNeighborsClassifier
You can also use the help() function to access the official documentation about kNN Classifier.
help(KNeighborsClassifier)
The following knn object is initialized from the KNeighborsClassifier class with the n_neighbors parameter set to 3.
knn = KNeighborsClassifier(n_neighbors=3)
The following code constructs a KNN model using the training dataset.
knn.fit(X_train, y_train)
KNeighborsClassifier(n_neighbors=3)In a Jupyter environment, please rerun this cell to show the HTML representation or trust the notebook.
On GitHub, the HTML representation is unable to render, please try loading this page with nbviewer.org.
KNeighborsClassifier(n_neighbors=3)
The predict() method is used to predict the output for the provided input data. The following code performs predictions for the first five samples in the training dataset.
knn.predict(X_train[:5])
array([1, 1, 0, 1, 0])
The following code performs predictions for the first five samples in the training dataset.
knn.predict(X_test[:5])
array([0, 1, 1, 0, 1])
The score() method measures a model’s performance on the given input-output pairs by calculating the ratio of correctly classified samples. The following code returns the performance of the trained kNN model on the training dataset.
knn.score(X_train, y_train)
0.9577464788732394
Alternatively, this can be computed by following these steps:
Predict the values for the entire training set.
Compare the predicted values with the actual values.
Count the number of correct predictions (True values).
Determine the total number of samples.
Calculate the accuracy by dividing the number of correctly classified samples by the total number of samples.
knn.predict(X_train)
array([1, 1, 0, 1, 0, 1, 1, 1, 1, 1, 1, 1, 0, 1, 0, 1, 0, 0, 1, 1, 0, 1,
       0, 0, 0, 1, 1, 1, 1, 1, 1, 0, 1, 1, 1, 1, 0, 0, 1, 1, 0, 1, 1, 1,
       1, 0, 1, 1, 0, 0, 1, 1, 0, 0, 1, 1, 1, 1, 1, 0, 0, 0, 1, 1, 1, 0,
       1, 1, 1, 1, 1, 0, 1, 0, 1, 0, 1, 0, 1, 0, 1, 1, 1, 1, 0, 1, 0, 0,
       1, 1, 0, 0, 1, 1, 0, 1, 0, 0, 0, 1, 0, 1, 0, 1, 0, 0, 0, 0, 1, 1,
       1, 0, 1, 0, 1, 0, 1, 1, 0, 1, 1, 1, 1, 1, 1, 1, 1, 1, 1, 1, 1, 1,
       0, 1, 1, 1, 0, 1, 1, 1, 1, 1, 1, 0, 1, 0, 1, 1, 1, 1, 0, 0, 1, 0,
       0, 1, 0, 1, 1, 1, 1, 0, 1, 1, 1, 1, 0, 0, 0, 1, 1, 1, 1, 0, 0, 1,
       1, 1, 1, 1, 1, 1, 0, 1, 1, 0, 1, 0, 1, 1, 1, 1, 0, 0, 1, 0, 1, 0,
       1, 0, 0, 1, 1, 1, 1, 1, 0, 1, 1, 0, 1, 1, 0, 0, 1, 1, 1, 0, 1, 1,
       1, 0, 1, 0, 1, 0, 1, 0, 1, 0, 0, 0, 0, 1, 1, 1, 1, 0, 0, 1, 1, 1,
       1, 1, 0, 1, 1, 0, 1, 1, 0, 0, 0, 0, 1, 1, 0, 1, 1, 1, 0, 0, 1, 1,
       1, 1, 1, 0, 0, 0, 1, 0, 0, 1, 1, 1, 1, 1, 1, 0, 1, 1, 1, 0, 1, 1,
       1, 0, 1, 0, 1, 0, 0, 1, 1, 1, 1, 1, 0, 0, 0, 1, 1, 0, 0, 1, 1, 0,
       1, 0, 0, 1, 0, 1, 1, 1, 1, 1, 1, 1, 0, 0, 1, 1, 1, 0, 1, 1, 1, 1,
       0, 1, 0, 0, 0, 1, 0, 1, 0, 1, 0, 0, 1, 1, 1, 1, 1, 1, 1, 1, 0, 0,
       0, 0, 0, 1, 1, 1, 1, 1, 1, 1, 0, 1, 0, 1, 1, 1, 1, 1, 0, 0, 0, 1,
       0, 1, 1, 1, 0, 1, 0, 1, 0, 0, 0, 1, 0, 1, 0, 1, 1, 0, 1, 1, 0, 1,
       1, 1, 1, 0, 1, 1, 0, 1, 1, 1, 0, 0, 1, 1, 1, 0, 1, 1, 0, 1, 1, 1,
       1, 1, 0, 0, 0, 1, 1, 1])
knn.predict(X_train) == y_train
array([ True,  True,  True,  True,  True,  True,  True,  True,  True,
        True,  True,  True,  True,  True,  True,  True,  True,  True,
        True,  True,  True,  True,  True,  True,  True,  True,  True,
        True,  True,  True,  True,  True,  True,  True,  True,  True,
        True,  True,  True,  True,  True,  True,  True,  True,  True,
        True,  True,  True,  True,  True,  True,  True,  True,  True,
        True,  True, False,  True,  True,  True,  True,  True,  True,
        True,  True,  True,  True,  True,  True,  True,  True,  True,
        True,  True,  True,  True,  True,  True,  True,  True,  True,
        True,  True,  True,  True,  True,  True, False,  True,  True,
        True, False,  True,  True,  True,  True, False,  True,  True,
        True,  True,  True,  True,  True,  True,  True,  True,  True,
        True, False,  True,  True,  True,  True,  True,  True,  True,
        True,  True,  True,  True,  True,  True,  True,  True,  True,
        True,  True,  True,  True,  True,  True,  True,  True,  True,
        True,  True,  True,  True,  True,  True,  True,  True,  True,
        True,  True,  True,  True, False,  True,  True,  True,  True,
        True,  True,  True, False, False,  True,  True,  True,  True,
        True,  True,  True,  True, False,  True,  True,  True,  True,
        True,  True,  True,  True,  True,  True,  True,  True, False,
        True,  True,  True,  True,  True,  True,  True,  True,  True,
        True,  True,  True,  True,  True, False,  True,  True,  True,
        True,  True,  True,  True,  True,  True,  True,  True,  True,
        True,  True,  True,  True,  True,  True,  True,  True,  True,
        True,  True, False,  True,  True,  True,  True, False,  True,
        True,  True,  True,  True,  True,  True,  True,  True,  True,
        True,  True,  True,  True,  True,  True,  True,  True,  True,
        True,  True,  True,  True,  True,  True,  True,  True,  True,
        True,  True,  True,  True,  True,  True,  True,  True,  True,
        True,  True,  True,  True,  True,  True,  True,  True,  True,
        True,  True,  True,  True,  True,  True,  True,  True,  True,
        True,  True,  True,  True, False,  True,  True, False,  True,
        True,  True,  True,  True,  True,  True,  True,  True,  True,
        True,  True,  True,  True,  True,  True,  True,  True,  True,
        True,  True,  True,  True,  True,  True,  True,  True,  True,
        True,  True,  True,  True,  True,  True,  True,  True,  True,
        True,  True,  True,  True,  True,  True,  True,  True,  True,
        True,  True,  True,  True,  True,  True,  True,  True,  True,
        True,  True,  True,  True,  True,  True,  True,  True,  True,
        True,  True,  True,  True,  True,  True,  True,  True,  True,
        True,  True,  True,  True,  True,  True,  True,  True,  True,
        True,  True,  True,  True,  True,  True,  True,  True, False,
        True, False,  True,  True,  True,  True,  True,  True,  True,
        True,  True,  True,  True,  True, False,  True,  True,  True,
        True,  True,  True,  True,  True,  True,  True,  True,  True,
        True,  True,  True,  True,  True,  True,  True,  True,  True,
        True,  True,  True,  True,  True,  True,  True,  True,  True,
        True,  True,  True])
sum(knn.predict(X_train) == y_train)
408
len(X_train)
426
sum(knn.predict(X_train) == y_train)/len(X_train)
0.9577464788732394
The following code returns the performance of the trained kNN model on the test dataset.
knn.score(X_test, y_test)
0.9230769230769231
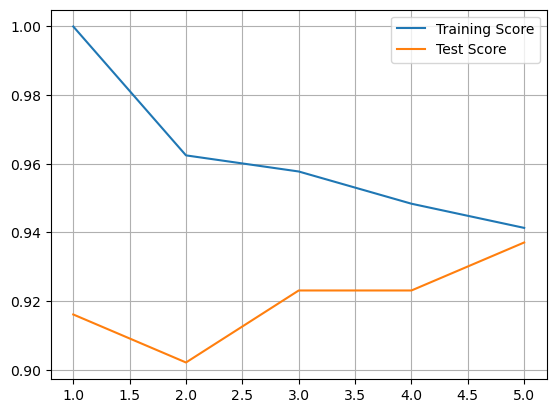
In the following code, training and test scores are computed and stored for n_neighbors values ranging from 1 to 5.
N = 5
train_score = []
test_score  = []
for i in range(1,N+1):
  knn = KNeighborsClassifier(n_neighbors=i)
  knn.fit(X_train, y_train)
  train_score.append(knn.score(X_train,y_train))
  test_score.append(knn.score(X_test,y_test))
import matplotlib.pyplot as plt
plt.plot(range(1,N+1),train_score, label='Training Score')
plt.plot(range(1,N+1),test_score, label='Test Score')
plt.grid()
plt.legend();
KNeighborsRegressor#
In regression tasks, the output is a continuous variable.
Similar to the classification case, the nearest neighbors are identified.
The predicted output value is the mean of the output values of the nearest neighbors from the training set.
For the test samples represented by red and blue above, the predicted output values are the averages of the outputs of the three nearest neighbors located inside the circles.
Data#
from sklearn.datasets import fetch_california_housing
X, y = fetch_california_housing(return_X_y=True)
print(f'Input Shape: {X.shape}  ------  Output Shape: {y.shape}')
Input Shape: (20640, 8) ------ Output Shape: (20640,)
from sklearn.model_selection import train_test_split
X_train, X_test, y_train, y_test = train_test_split(X, y, random_state=0)
print(f'Training Input Shape: {X_train.shape}  ------  Training Output Shape: {y_train.shape}')
print(f'Test     Input Shape: {X_test.shape}  ------  Test Output Shape     : {y_train.shape}')
Training Input Shape: (15480, 8)  ------  Training Output Shape: (15480,)
Test     Input Shape: (5160, 8)  ------  Test Output Shape     : (15480,)
Coding#
KNeighborsRegressor class is imported from the neighbors module of sklearn.
from sklearn.neighbors import KNeighborsRegressor
You can also use the help() function to access the official documentation about kNN Regressor.
help(KNeighborsRegressor)
The following knn object is initialized from the KNeighborsRegressor class with the n_neighbors parameter set to 3.
knn = KNeighborsRegressor(n_neighbors=3)
The following code constructs a KNN model using the training dataset.
knn.fit(X_train, y_train)
KNeighborsRegressor(n_neighbors=3)In a Jupyter environment, please rerun this cell to show the HTML representation or trust the notebook.
On GitHub, the HTML representation is unable to render, please try loading this page with nbviewer.org.
KNeighborsRegressor(n_neighbors=3)
The predict() method is used to predict the output for the provided input data. The following code performs predictions for the first five samples in the training dataset.
knn.predict(X_train[:5])
array([2.514 , 2.31366667, 1.368 , 3.14600333, 0.954 ])
The following code performs predictions for the first five samples in the training dataset.
knn.predict(X_test[:5])
array([1.82266667, 2.228 , 3.08833333, 2.405 , 1.89566667])
The score() method measures a model’s performance on the given input-output pairs by calculating the coefficient of determination. The following code returns the performance of the trained kNN model on the training dataset.
knn.score(X_train, y_train)
0.5713267568740368
The following code returns the performance of the trained kNN model on the test dataset.
knn.score(X_test, y_test)
0.11587927803940512
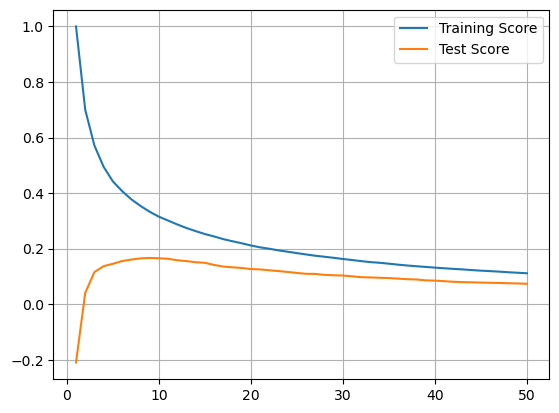
In the following code, training and test scores are computed and stored for n_neighbors values ranging from 1 to 50.
N = 50
train_score = []
test_score  = []
for i in range(1,N+1):
  knn = KNeighborsRegressor(n_neighbors=i)
  knn.fit(X_train, y_train)
  train_score.append(knn.score(X_train,y_train))
  test_score.append(knn.score(X_test,y_test))
import matplotlib.pyplot as plt
plt.plot(range(1,N+1),train_score, label='Training Score')
plt.plot(range(1,N+1),test_score, label='Test Score')
plt.grid()
plt.legend();