Random Forest#

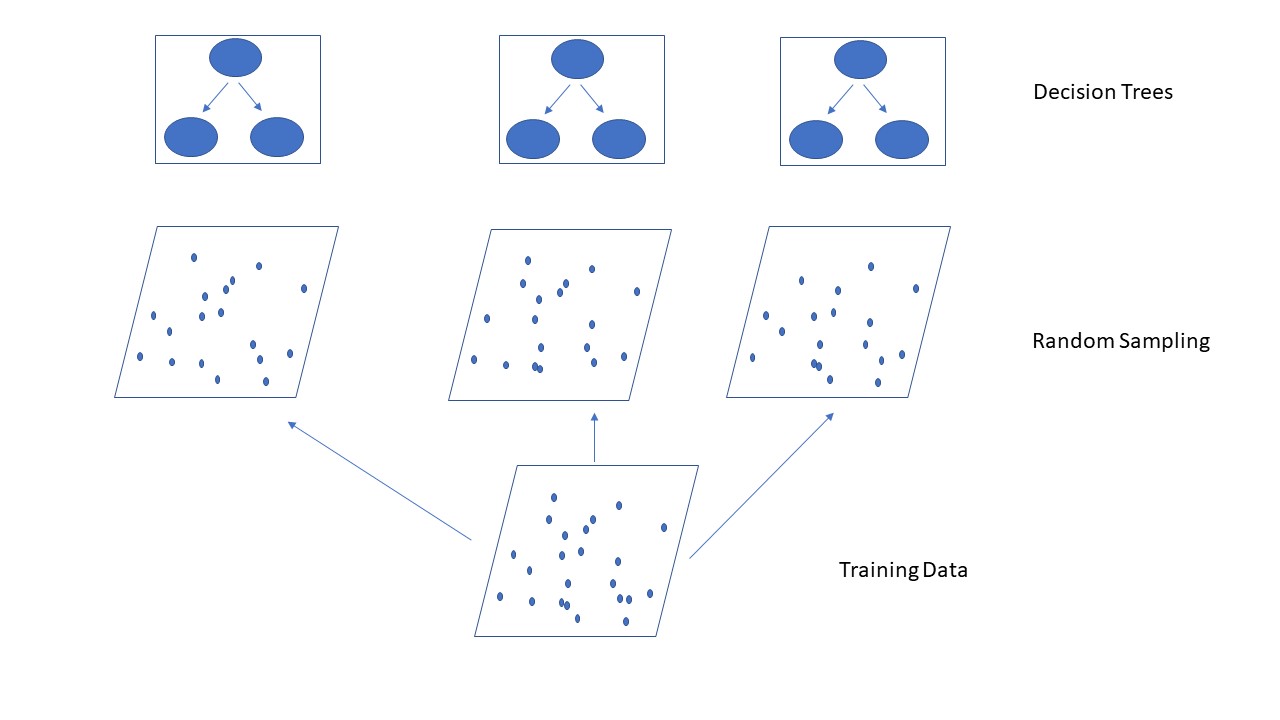
The random forest is an ensemble of decision trees used for classification and regression tasks.
Decision trees work together to make better predictions and reduce errors.
A key aspect of the algorithm is incorporating randomness to generate diverse decision trees. This is achieved in two primary ways:
Bagging: Using randomly chosen samples from the initial training set with some repititions for each decision tree.
Applying the max_feature hyperparameter to randomly select features for splitting each node.
The algorithm constructs multiple different decision trees and combines them to produce a more accurate and stable prediction, introducing additional randomness while growing the trees.
The final decision (prediction) is made as follows:
For classification, soft voting is used, considering predicted probabilities.
For regression, predictions are combined by averaging the results.
Random Forest Classifier#
from sklearn.datasets import load_breast_cancer
X, y = load_breast_cancer(return_X_y=True)
from sklearn.model_selection import train_test_split
X_train, X_test, y_train, y_test = train_test_split(X, y, random_state=0)
from sklearn.ensemble import RandomForestClassifier
rf = RandomForestClassifier(random_state=0)
rf.fit(X_train, y_train)
RandomForestClassifier(random_state=0)In a Jupyter environment, please rerun this cell to show the HTML representation or trust the notebook.
On GitHub, the HTML representation is unable to render, please try loading this page with nbviewer.org.
RandomForestClassifier(random_state=0)
rf.score(X_train, y_train)
1.0
rf.score(X_test, y_test)
0.972027972027972
n_estimators#
This parameter is used to specify the number of decision trees to be included in the model.
from sklearn.ensemble import RandomForestClassifier
rf = RandomForestClassifier(n_estimators=10, random_state=0)
rf.fit(X_train, y_train)
RandomForestClassifier(n_estimators=10, random_state=0)In a Jupyter environment, please rerun this cell to show the HTML representation or trust the notebook.
On GitHub, the HTML representation is unable to render, please try loading this page with nbviewer.org.
RandomForestClassifier(n_estimators=10, random_state=0)
rf.score(X_train, y_train)
1.0
rf.score(X_test, y_test)
0.951048951048951
for ne in [10, 20, 40, 50, 100]:
    rf = RandomForestClassifier(n_estimators=ne, max_depth=2, random_state=0)
    rf.fit(X_train, y_train)
    print(f'Number of Trees: {ne} --- Training Score: {rf.score(X_train, y_train):.2f} --- Test Score: {rf.score(X_test, y_test):.2f}')
Number of Trees: 10 --- Training Score: 0.95 --- Test Score: 0.97
Number of Trees: 20 --- Training Score: 0.96 --- Test Score: 0.97
Number of Trees: 40 --- Training Score: 0.97 --- Test Score: 0.97
Number of Trees: 50 --- Training Score: 0.97 --- Test Score: 0.97
Number of Trees: 100 --- Training Score: 0.96 --- Test Score: 0.96
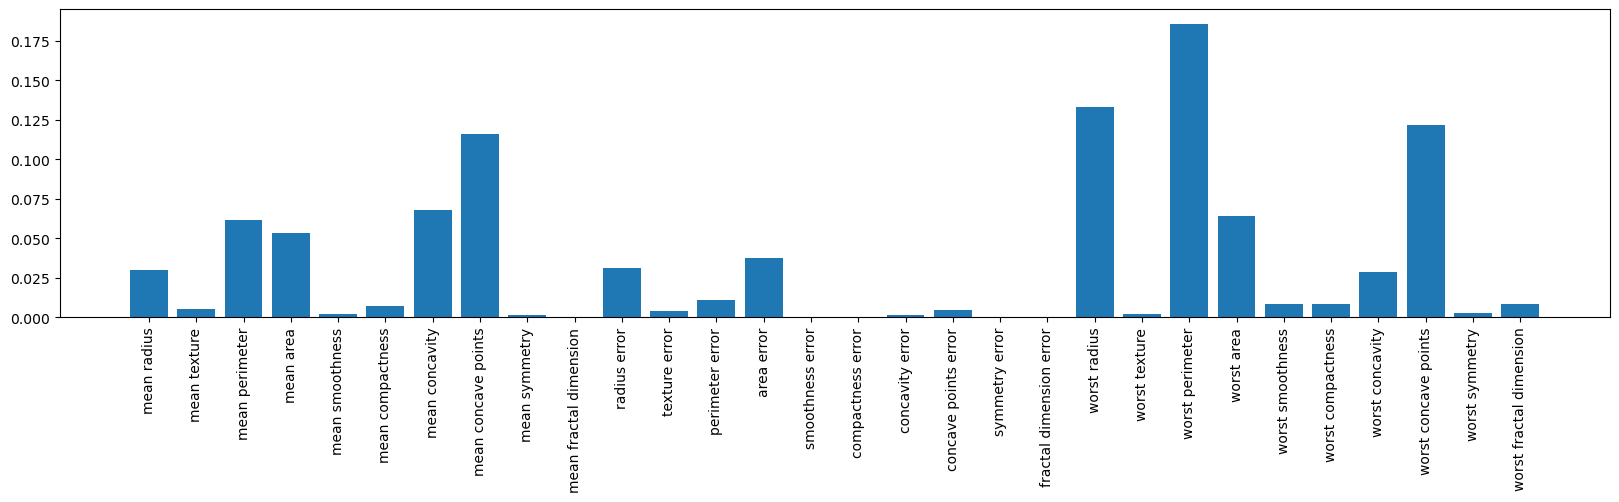
Feature Importances#
The feature_importances_ attribute returns the significance of each feature in building the model using the Random Forest algorithm.
The sum of the importances for all features equals 1.
rf.feature_importances_
array([3.03146148e-02, 5.10500369e-03, 6.17712997e-02, 5.35757452e-02,
       1.98074648e-03, 7.26183129e-03, 6.82845741e-02, 1.15938370e-01,
       1.33644616e-03, 2.47844515e-04, 3.15481379e-02, 3.82948809e-03,
       1.07409521e-02, 3.77591122e-02, 0.00000000e+00, 1.17547311e-04,
       1.22963830e-03, 4.54687870e-03, 0.00000000e+00, 4.11727249e-04,
       1.33369060e-01, 1.89391783e-03, 1.85689644e-01, 6.42969350e-02,
       8.69161951e-03, 8.48533691e-03, 2.85407256e-02, 1.22046376e-01,
       2.51496314e-03, 8.47146445e-03])
import matplotlib.pyplot as plt
plt.figure(figsize=(20,4))
plt.bar(load_breast_cancer().feature_names, rf.feature_importances_)
plt.xticks(rotation=90);
Random Forest Regressor#
from sklearn.datasets import fetch_california_housing
X, y = fetch_california_housing(return_X_y=True)
from sklearn.model_selection import train_test_split
X_train, X_test, y_train, y_test = train_test_split(X, y, random_state=0)
from sklearn.ensemble import RandomForestRegressor
rf = RandomForestRegressor(random_state=0)
rf.fit(X_train, y_train)
RandomForestRegressor(random_state=0)In a Jupyter environment, please rerun this cell to show the HTML representation or trust the notebook.
On GitHub, the HTML representation is unable to render, please try loading this page with nbviewer.org.
RandomForestRegressor(random_state=0)
rf.score(X_train, y_train)
0.972774690316785
rf.score(X_test, y_test)
0.793952082698899
n_estimators#
from sklearn.ensemble import RandomForestRegressor
rf = RandomForestRegressor(n_estimators=10, random_state=0)
rf.fit(X_train, y_train)
RandomForestRegressor(n_estimators=10, random_state=0)In a Jupyter environment, please rerun this cell to show the HTML representation or trust the notebook.
On GitHub, the HTML representation is unable to render, please try loading this page with nbviewer.org.
RandomForestRegressor(n_estimators=10, random_state=0)
rf.score(X_train, y_train)
0.9602653623018315
rf.score(X_test, y_test)
0.7750266107715603
for ne in [10, 20, 40, 50, 100]:
    rf = RandomForestRegressor(n_estimators=ne, random_state=0)
    rf.fit(X_train, y_train)
    print(f'Number of Trees: {ne} --- Training Score: {rf.score(X_train, y_train):.2f} --- Test Score: {rf.score(X_test, y_test):.2f}')
Number of Trees: 10 --- Training Score: 0.96 --- Test Score: 0.78
Number of Trees: 20 --- Training Score: 0.97 --- Test Score: 0.78
Number of Trees: 40 --- Training Score: 0.97 --- Test Score: 0.79
Number of Trees: 50 --- Training Score: 0.97 --- Test Score: 0.79
Number of Trees: 100 --- Training Score: 0.97 --- Test Score: 0.79
for ne in [10, 20, 40]:
    for md in [2, 3, 4, 5, 10]:
        rf = RandomForestRegressor(n_estimators=ne, max_depth=md, random_state=0)
        rf.fit(X_train, y_train)
        print(f'Number of Trees: {ne} --- Max Depth: {md}--- Training Score: {rf.score(X_train, y_train):.2f} --- Test Score: {rf.score(X_test, y_test):.2f}')
Number of Trees: 10 --- Max Depth: 2--- Training Score: 0.47 --- Test Score: 0.45
Number of Trees: 10 --- Max Depth: 3--- Training Score: 0.57 --- Test Score: 0.54
Number of Trees: 10 --- Max Depth: 4--- Training Score: 0.64 --- Test Score: 0.60
Number of Trees: 10 --- Max Depth: 5--- Training Score: 0.68 --- Test Score: 0.64
Number of Trees: 10 --- Max Depth: 10--- Training Score: 0.86 --- Test Score: 0.76
Number of Trees: 20 --- Max Depth: 2--- Training Score: 0.47 --- Test Score: 0.45
Number of Trees: 20 --- Max Depth: 3--- Training Score: 0.57 --- Test Score: 0.54
Number of Trees: 20 --- Max Depth: 4--- Training Score: 0.63 --- Test Score: 0.60
Number of Trees: 20 --- Max Depth: 5--- Training Score: 0.68 --- Test Score: 0.64
Number of Trees: 20 --- Max Depth: 10--- Training Score: 0.87 --- Test Score: 0.76
Number of Trees: 40 --- Max Depth: 2--- Training Score: 0.47 --- Test Score: 0.44
Number of Trees: 40 --- Max Depth: 3--- Training Score: 0.57 --- Test Score: 0.54
Number of Trees: 40 --- Max Depth: 4--- Training Score: 0.64 --- Test Score: 0.60
Number of Trees: 40 --- Max Depth: 5--- Training Score: 0.68 --- Test Score: 0.64
Number of Trees: 40 --- Max Depth: 10--- Training Score: 0.87 --- Test Score: 0.76
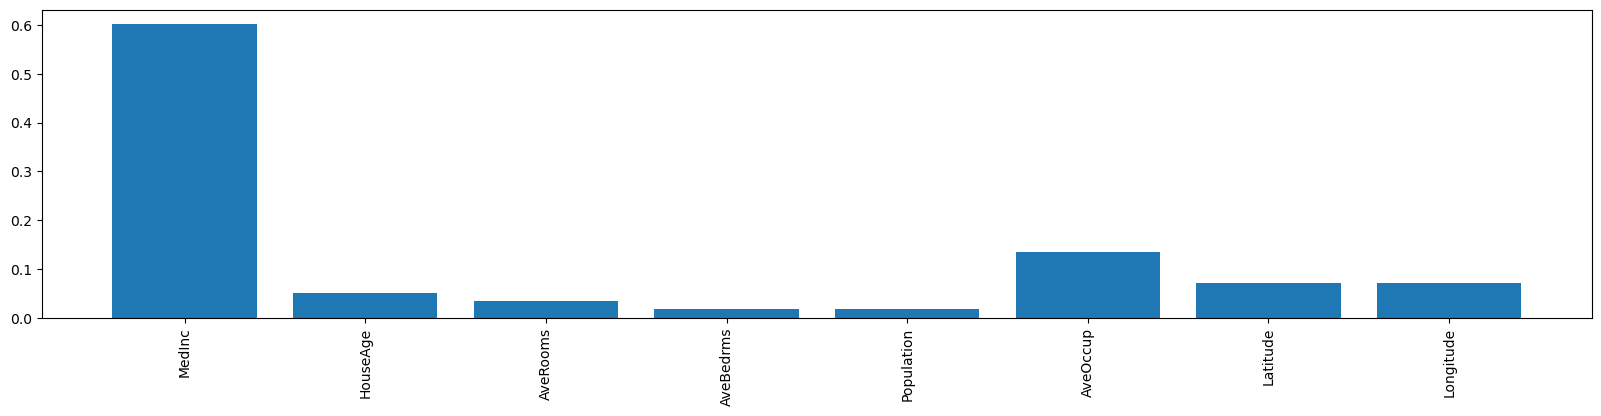
Feature Importances#
rf.feature_importances_
array([0.60126682, 0.05132849, 0.03458775, 0.01762482, 0.01736841,
       0.1352393 , 0.07189581, 0.0706886 ])
import matplotlib.pyplot as plt
plt.figure(figsize=(20,4))
plt.bar(fetch_california_housing().feature_names, rf.feature_importances_)
plt.xticks(rotation=90);