Visualization Examples#

import seaborn as sns
import matplotlib.pyplot as plt
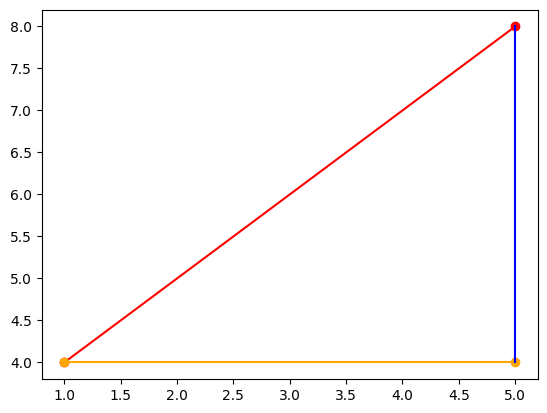
Triangle#
The given code displays a triangle with distinct colors on each side.
plt.plot([1,5],[4,8], marker='o', c='r')
plt.plot([1,5],[4,4], marker='o',c='orange')
plt.plot([5,5],[4,8], c='b');
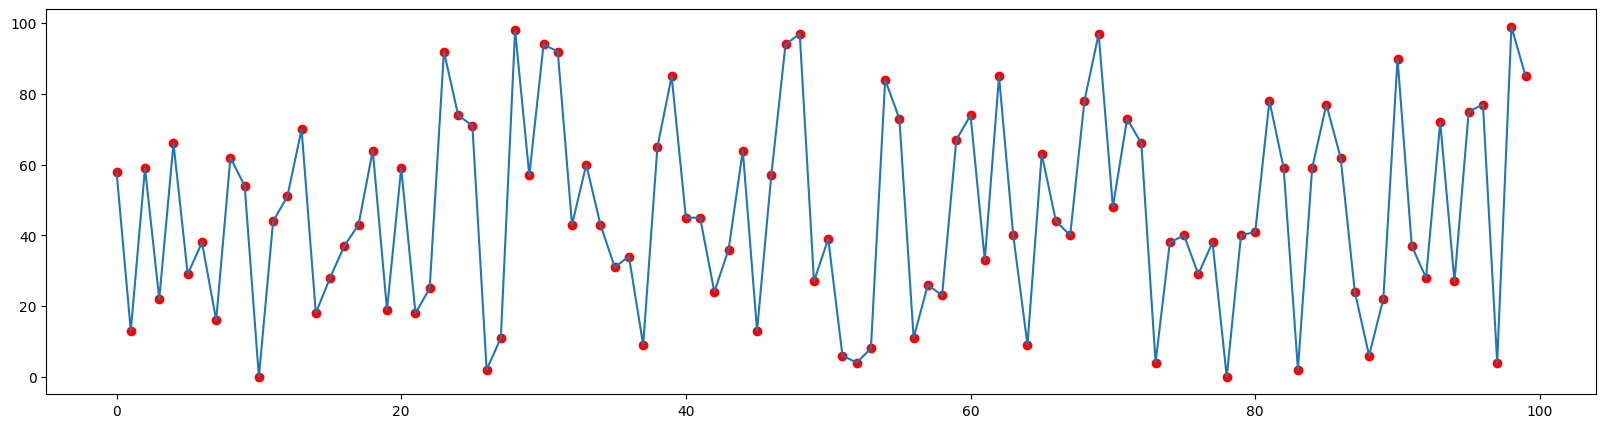
Line with Markers#
Generate line and scatter plots for a randomly selected set of 100 numbers.
import numpy as np
random_numbers = np.random.randint(0,100,(100,)) # 100 random numbers between 0 and 100

plt.figure(figsize=(20,5))
plt.plot(random_numbers)
plt.scatter(range(100), random_numbers, c='r');