Series#

A Series is a one-dimensional data structure in the Pandas library, distinguished by a labeled axis for rows.
It resembles a column in a table, with row labels referred to as the index.
A Series can contain data of any type.
It supports vectorized operations, allowing efficient computations across rows or columns, and facilitates data visualization.
The Pandas library is typically imported with the abbreviation pd for brevity in code:
import pandas as pd.
Create Series#
You can use a tuple, list, or numpy array to create a Series.
Use
pd.Series()to create a series.When using pd.Series(), you can provide row labels. If they are not provided, default values \(0, 1, 2, \ldots\) are used.
The name parameter allows you to assign a name to the Series.
import pandas as pd
state_tuple = ('NJ', 'NY', 'TX', 'AZ', 'MO')
pd.Series(state_tuple)
0    NJ
1    NY
2    TX
3    AZ
4    MO
dtype: object
state_list = ['NJ', 'NY', 'TX', 'AZ', 'MO']
pd.Series(state_list)
0    NJ
1    NY
2    TX
3    AZ
4    MO
dtype: object
import numpy as np
state_array = np.array(['NJ', 'NY', 'TX', 'AZ', 'MO'])
pd.Series(state_array)
0    NJ
1    NY
2    TX
3    AZ
4    MO
dtype: object
You can provide row labels using the index parameter.
pd.Series( state_list , index=['S-1', 'S-2', 'S-3', 'S-4', 'S-5'])
S-1    NJ
S-2    NY
S-3    TX
S-4    AZ
S-5    MO
dtype: object
You can assign a name to the Series using the name parameter.
pd.Series( state_list , index=['S-1', 'S-2', 'S-3', 'S-4', 'S-5'], name='States')
S-1    NJ
S-2    NY
S-3    TX
S-4    AZ
S-5    MO
Name: States, dtype: object
Accessing values#
Square brackets, along with the loc and iloc operators, can be used to access values in a Series. - For row labels: Use [row label]. - For row labels: Use loc[row label]. - For row indexes: Use iloc[row index].
We will use the following Series.
state_series = pd.Series( state_list , index=['S-1', 'S-2', 'S-3', 'S-4', 'S-5'], name='States')
state_series
S-1    NJ
S-2    NY
S-3    TX
S-4    AZ
S-5    MO
Name: States, dtype: object
The square brackets can be used to access single or multiple rows using row labels.
# row with label 'S-3'
state_series['S-3']
'TX'
To handle multiple rows, you can use a list.
# rows with labels 'S-3' and 'S-4'
state_series[['S-3','S-4']]
S-3    TX
S-4    AZ
Name: States, dtype: object
The
locoperator also can be used to access single or multiple rows using row labels.
# row with label 'S-3'
state_series.loc['S-3']
'TX'
# rows with labels 'S-3' and 'S-4'
state_series.loc[['S-3','S-4']]
S-3    TX
S-4    AZ
Name: States, dtype: object
state_series.iloc[3]
'AZ'
The
ilocoperator can be used to access single or multiple rows using row indexes.
# row with index 2
state_series.iloc[2]
'TX'
# rows with indexes 2 and 3
state_series.iloc[[2,3]]
S-3    TX
S-4    AZ
Name: States, dtype: object
Slicing#
Square brackets, along with the loc and iloc operators, and the colon (:), can be used to access a slice in a Series.
WARNING: When using square brackets or the loc operator, the value corresponding to the end label is included. However, with the iloc operator, the value corresponding to the end index is not included.
state_series
S-1    NJ
S-2    NY
S-3    TX
S-4    AZ
S-5    MO
Name: States, dtype: object
# rows with labels: 'S-2', 'S-3', 'S-4'
state_series['S-2':'S-4']
S-2    NY
S-3    TX
S-4    AZ
Name: States, dtype: object
# rows with indexes: 1, 2
state_series.iloc[1:3]
S-2    NY
S-3    TX
Name: States, dtype: object
Adding a New Row#
To add a new row, use either of the following methods:
state_series[‘new_row_label’] = new_value
state_series.loc[‘new_row_label’] = new_value
state_series
S-1    NJ
S-2    NY
S-3    TX
S-4    AZ
S-5    MO
Name: States, dtype: object
state_series['S-6'] = 'FL'
state_series
S-1    NJ
S-2    NY
S-3    TX
S-4    AZ
S-5    MO
S-6    FL
Name: States, dtype: object
state_series.loc['S-7'] = 'CA'
state_series
S-1    NJ
S-2    NY
S-3    TX
S-4    AZ
S-5    MO
S-6    FL
S-7    CA
Name: States, dtype: object
Changing a Value#
To change a value in a Series, use any of the following methods:
state_series[‘row_label’] = new_value
state_series.loc[‘row_label’] = new_value
state_series.iloc[row_index] = new_value
The following code changes the value at the index ‘S-7’ to ‘MA’.
state_series.loc['S-7'] = 'MA'
state_series
S-1    NJ
S-2    NY
S-3    TX
S-4    AZ
S-5    MO
S-6    FL
S-7    MA
Name: States, dtype: object
Change the value at the index ‘S-7’ to ‘TN’.
state_series.loc['S-7'] = 'TN'
state_series
S-1    NJ
S-2    NY
S-3    TX
S-4    AZ
S-5    MO
S-6    FL
S-7    TN
Name: States, dtype: object
Change the value at the index 6 to ‘ID’.
state_series.iloc[6] =  'ID'
state_series
S-1    NJ
S-2    NY
S-3    TX
S-4    AZ
S-5    MO
S-6    FL
S-7    ID
Name: States, dtype: object
Changing Row Labels#
The row labels of a Series can be modified by assigning new_row_labels to state_series.index.
The following labels will be the new row labels.
new_labels = ['St-'+str(i) for i in range(1,8)]
new_labels
['St-1', 'St-2', 'St-3', 'St-4', 'St-5', 'St-6', 'St-7']
state_series.index = new_labels
state_series
St-1    NJ
St-2    NY
St-3    TX
St-4    AZ
St-5    MO
St-6    FL
St-7    ID
Name: States, dtype: object
Vectorized Operations#
Vectorized operations can be performed using the values of a Series or between two or more Series.
We will use the following two test grades:
test1_grades = pd.Series( [90, 85, 70, 80, 60, 60],   index = ['Jack', 'Joe', 'Amy', 'Ted', 'Mia', 'Ben'], name='Test-1')
test1_grades
Jack    90
Joe     85
Amy     70
Ted     80
Mia     60
Ben     60
Name: Test-1, dtype: int64
test2_grades = pd.Series( [50, 70, 30, 90, 95, 75],   index = ['Jack', 'Joe', 'Amy', 'Ted', 'Mia', 'Ben'], name='Test-2')
test2_grades
Jack    50
Joe     70
Amy     30
Ted     90
Mia     95
Ben     75
Name: Test-2, dtype: int64
Multiply each Test-1 value by 2
2*test1_grades
Jack    180
Joe     170
Amy     140
Ted     160
Mia     120
Ben     120
Name: Test-1, dtype: int64
Divide each Test-1 value by 100
test1_grades/100
Jack    0.90
Joe     0.85
Amy     0.70
Ted     0.80
Mia     0.60
Ben     0.60
Name: Test-1, dtype: float64
Sum of Test-1 and Test-2 grades
test1_grades + test2_grades
Jack    140
Joe     155
Amy     100
Ted     170
Mia     155
Ben     135
dtype: int64
Difference of Test-1 and Test-2 grades
test1_grades - test2_grades
Jack    40
Joe     15
Amy     40
Ted    -10
Mia    -35
Ben    -15
dtype: int64
Weighted average of Test-1 and Test-2 grades.
0.3*test1_grades + 0.7*test2_grades
Jack    62.0
Joe     74.5
Amy     42.0
Ted     87.0
Mia     84.5
Ben     70.5
dtype: float64
Comparison Operations#
Comparison operators can be applied to the values of a Series, returning boolean values for each row.
test1_grades
Jack    90
Joe     85
Amy     70
Ted     80
Mia     60
Ben     60
Name: Test-1, dtype: int64
# grades less than 75
test1_grades < 75
Jack    False
Joe     False
Amy      True
Ted     False
Mia      True
Ben      True
Name: Test-1, dtype: bool
Filtering#
Comparison operations can be used to filter rows based on the boolean values returned by comparison operators.
# the rows with test1_grades < 75
test1_grades[test1_grades < 75]
Amy    70
Mia    60
Ben    60
Name: Test-1, dtype: int64
Attributes#
Attributes provide information about the properties and characteristics of objects.
shape and len()#
shapereturns the tuple (number of rows, ).len()returns the number of rows.
state_series
St-1    NJ
St-2    NY
St-3    TX
St-4    AZ
St-5    MO
St-6    FL
St-7    ID
Name: States, dtype: object
state_series.shape
(7,)
len(state_series)
7
index#
index returns row labels.
state_series
St-1    NJ
St-2    NY
St-3    TX
St-4    AZ
St-5    MO
St-6    FL
St-7    ID
Name: States, dtype: object
state_series.index
Index(['St-1', 'St-2', 'St-3', 'St-4', 'St-5', 'St-6', 'St-7'], dtype='object')
values#
The values attribute removes labels and returns an array.
state_series
St-1    NJ
St-2    NY
St-3    TX
St-4    AZ
St-5    MO
St-6    FL
St-7    ID
Name: States, dtype: object
state_series.values
array(['NJ', 'NY', 'TX', 'AZ', 'MO', 'FL', 'ID'], dtype=object)
Methods#
Methods can manipulate the data and perform actions on it.
head() and tail()#
They are primarily used for large Series to display only a specific number of rows.
head(n) displays the first n rows.
tail(n) displays the last n rows.
The default value of \(n\) is 5.
# first 5 rows
state_series.head()
St-1    NJ
St-2    NY
St-3    TX
St-4    AZ
St-5    MO
Name: States, dtype: object
# first 2 rows
state_series.head(2)
St-1    NJ
St-2    NY
Name: States, dtype: object
# last 5 rows
state_series.tail()
St-3    TX
St-4    AZ
St-5    MO
St-6    FL
St-7    ID
Name: States, dtype: object
# last 2 rows
state_series.tail(2)
St-6    FL
St-7    ID
Name: States, dtype: object
info()#
The info() method provides basic information about the Series, including:
row labels: Jack to Ben
number of rows: 5 entries
Non-null (non-missing) values: 5 non-null
dtype: int64
memory usage: 252.0+ bytes
test1_grades
Jack    90
Joe     85
Amy     70
Ted     80
Mia     60
Ben     60
Name: Test-1, dtype: int64
test1_grades.info()
<class 'pandas.core.series.Series'>
Index: 6 entries, Jack to Ben
Series name: Test-1
Non-Null Count  Dtype
--------------  -----
6 non-null      int64
dtypes: int64(1)
memory usage: 268.0+ bytes
describe()#
It returns the descriptive statistics of the values of the Series, including:
Count
Mean
Standard deviation (std)
Minimum (min)
25th percentile
50th percentile (median)
75th percentile
Maximum (max)
test1_grades.describe()
count     6.000000
mean     74.166667
std      12.812754
min      60.000000
25%      62.500000
50%      75.000000
75%      83.750000
max      90.000000
Name: Test-1, dtype: float64
value_counts()#
It returns the number of occurrences for each value of the column.
state_series
St-1    NJ
St-2    NY
St-3    TX
St-4    AZ
St-5    MO
St-6    FL
St-7    ID
Name: States, dtype: object
# one from each value
state_series.value_counts()
States
NJ    1
NY    1
TX    1
AZ    1
MO    1
FL    1
ID    1
Name: count, dtype: int64
# add 'AZ' as a new value
state_series['S-8'] = 'AZ'
state_series
St-1    NJ
St-2    NY
St-3    TX
St-4    AZ
St-5    MO
St-6    FL
St-7    ID
S-8     AZ
Name: States, dtype: object
# there are 2 AZ values
state_series.value_counts()
States
AZ    2
NJ    1
NY    1
TX    1
MO    1
FL    1
ID    1
Name: count, dtype: int64
copy()#
The copy() method returns a copy of the Series.
state_series_copy = state_series.copy()
state_series_copy
St-1    NJ
St-2    NY
St-3    TX
St-4    AZ
St-5    MO
St-6    FL
St-7    ID
S-8     AZ
Name: States, dtype: object
drop()#
The drop() method is used to remove row(s) from the Series.
state_series
St-1    NJ
St-2    NY
St-3    TX
St-4    AZ
St-5    MO
St-6    FL
St-7    ID
S-8     AZ
Name: States, dtype: object
state_series.drop('S-8')
St-1    NJ
St-2    NY
St-3    TX
St-4    AZ
St-5    MO
St-6    FL
St-7    ID
Name: States, dtype: object
By default, the drop() method does not change the Series.
It just displays how the Series would look if the dropping were performed.
# no change on state_series
state_series
St-1    NJ
St-2    NY
St-3    TX
St-4    AZ
St-5    MO
St-6    FL
St-7    ID
S-8     AZ
Name: States, dtype: object
To make a change to the Series, the parameter
inplaceshould be set to True, which is False by default.
state_series.drop('S-8', inplace=True)
# no 'S-8' row any more
state_series
St-1    NJ
St-2    NY
St-3    TX
St-4    AZ
St-5    MO
St-6    FL
St-7    ID
Name: States, dtype: object
reset_index()#
The reset_index() method is used to reset the row labels of a Series to default values: \(0, 1, 2, ...\)
It also adds the initial row labels as a new column with label index.
It returns a DataFrame (Similar to a Series, but it can have more than one column).
By default, the drop() method does not change the Series.
It just displays how the Series would look if the dropping were performed.
state_series_copy.reset_index()
| index | States | |
|---|---|---|
| 0 | St-1 | NJ |
| 1 | St-2 | NY |
| 2 | St-3 | TX |
| 3 | St-4 | AZ |
| 4 | St-5 | MO |
| 5 | St-6 | FL |
| 6 | St-7 | ID |
| 7 | S-8 | AZ |
If you do not want to keep the initial index values, you can set the drop parameter to True.
state_series_copy.reset_index(drop=True)
0    NJ
1    NY
2    TX
3    AZ
4    MO
5    FL
6    ID
7    AZ
Name: States, dtype: object
# no change on state_series_copy
state_series_copy
St-1    NJ
St-2    NY
St-3    TX
St-4    AZ
St-5    MO
St-6    FL
St-7    ID
S-8     AZ
Name: States, dtype: object
reset_index() does not change the Series unless inplace=True.
state_series_copy.reset_index(drop=True, inplace=True)
# indexes updated
state_series_copy
0    NJ
1    NY
2    TX
3    AZ
4    MO
5    FL
6    ID
7    AZ
Name: States, dtype: object
set_axis()#
The set_axis() method is used to assign new labels to the Series’ row indixes.
It does not have an inplace parameter to change the Series.
It returns a new Series.
new_labels = ['State-'+str(i) for i in range(7)]
new_labels
['State-0', 'State-1', 'State-2', 'State-3', 'State-4', 'State-5', 'State-6']
state_series.set_axis(new_labels)
State-0    NJ
State-1    NY
State-2    TX
State-3    AZ
State-4    MO
State-5    FL
State-6    ID
Name: States, dtype: object
# no change on state_series
state_series
St-1    NJ
St-2    NY
St-3    TX
St-4    AZ
St-5    MO
St-6    FL
St-7    ID
Name: States, dtype: object
sum(), mean(), median(), std()#
These operations can be applied directly to the values of the Series.
test1_grades
Jack    90
Joe     85
Amy     70
Ted     80
Mia     60
Ben     60
Name: Test-1, dtype: int64
test1_grades.sum()
445
test1_grades.mean()
74.16666666666667
test1_grades.median()
75.0
test1_grades.std()
12.812754062521714
sort_values()#
It sorts the series based on the values in ascending or descending order.
By default, sorting is done in ascending order.
To sort in descending order, set the
ascendingparameter to False.
test1_grades.sort_values()
Mia     60
Ben     60
Amy     70
Ted     80
Joe     85
Jack    90
Name: Test-1, dtype: int64
test1_grades.sort_values(ascending=False)
Jack    90
Joe     85
Ted     80
Amy     70
Mia     60
Ben     60
Name: Test-1, dtype: int64
To make a change to the Series, the parameter
inplaceshould be set to True, which is False by default.
test1_grades.sort_values(inplace=True)
test1_grades
Mia     60
Ben     60
Amy     70
Ted     80
Joe     85
Jack    90
Name: Test-1, dtype: int64
sort_index()#
It sorts the series based on the indexes in ascending or descending order.
By default, sorting is done in ascending order.
To sort in descending order, set the
ascendingparameter to False.
# alphabetical order
test1_grades.sort_index()
Amy     70
Ben     60
Jack    90
Joe     85
Mia     60
Ted     80
Name: Test-1, dtype: int64
test1_grades.sort_index(ascending=False)
Ted     80
Mia     60
Joe     85
Jack    90
Ben     60
Amy     70
Name: Test-1, dtype: int64
To make a change to the Series, the parameter
inplaceshould be set to True, which is False by default.
test1_grades.sort_index(inplace=True)
test1_grades
Amy     70
Ben     60
Jack    90
Joe     85
Mia     60
Ted     80
Name: Test-1, dtype: int64
duplicated()#
It returns a Series with boolean values showing if a row is a repeat or not.
state_series
St-1    NJ
St-2    NY
St-3    TX
St-4    AZ
St-5    MO
St-6    FL
St-7    ID
Name: States, dtype: object
# no repetition
state_series.duplicated()
St-1    False
St-2    False
St-3    False
St-4    False
St-5    False
St-6    False
St-7    False
Name: States, dtype: bool
# add a repeatition
state_series['St-8'] = 'AZ'
state_series
St-1    NJ
St-2    NY
St-3    TX
St-4    AZ
St-5    MO
St-6    FL
St-7    ID
St-8    AZ
Name: States, dtype: object
# second 'AZ' is repeated
state_series.duplicated()
St-1    False
St-2    False
St-3    False
St-4    False
St-5    False
St-6    False
St-7    False
St-8     True
Name: States, dtype: bool
drop_duplicates()#
It returns a Series with duplicate rows removed.
state_series
St-1    NJ
St-2    NY
St-3    TX
St-4    AZ
St-5    MO
St-6    FL
St-7    ID
St-8    AZ
Name: States, dtype: object
# The last row with the value 'AZ' has been removed.
state_series.drop_duplicates()
St-1    NJ
St-2    NY
St-3    TX
St-4    AZ
St-5    MO
St-6    FL
St-7    ID
Name: States, dtype: object
# no change
state_series
St-1    NJ
St-2    NY
St-3    TX
St-4    AZ
St-5    MO
St-6    FL
St-7    ID
St-8    AZ
Name: States, dtype: object
To make a change to the Series, the parameter
inplaceshould be set to True, which is False by default.
state_series.drop_duplicates(inplace=True)
# The last row with the value 'AZ' has been removed.
state_series
St-1    NJ
St-2    NY
St-3    TX
St-4    AZ
St-5    MO
St-6    FL
St-7    ID
Name: States, dtype: object
apply()#
The apply() function is used to apply a specific function to the values in a Series.
A lambda function is often used to define the function inline.
We will use a Series that represents the radius values of circles.
radius = pd.Series([2,5,6,8,9])
radius
0    2
1    5
2    6
3    8
4    9
dtype: int64
To calculate the area of a circle (disc), you can define a simple function.
import math

def area(r):
    return math.pi*r**2
Pass function name as an argument to the apply() function.
radius.apply(area)
0     12.566371
1     78.539816
2    113.097336
3    201.061930
4    254.469005
dtype: float64
Alternatively, with the lambda function version, there is no need to define a separate function name.
radius.apply(lambda r: math.pi*r**2)
0     12.566371
1     78.539816
2    113.097336
3    201.061930
4    254.469005
dtype: float64
Iterations and Series#
Series can be iterated through using their row labels or indexes. Here’s how you can access them:
Use state_series.index for row labels.
Use range(len(state_series)) or range(state_series.shape[0]) for row indexes.
# row labels
for row in state_series.index:
    print(row)
St-1
St-2
St-3
St-4
St-5
St-6
St-7
# access all values using the row labels
for row in state_series.index:
    print(state_series.loc[row])
NJ
NY
TX
AZ
MO
FL
ID
# access all values using the row indexes
for i in range(state_series.shape[0]):    # you can also use len(state_series)
    print(state_series.iloc[i])
NJ
NY
TX
AZ
MO
FL
ID
Visualization#
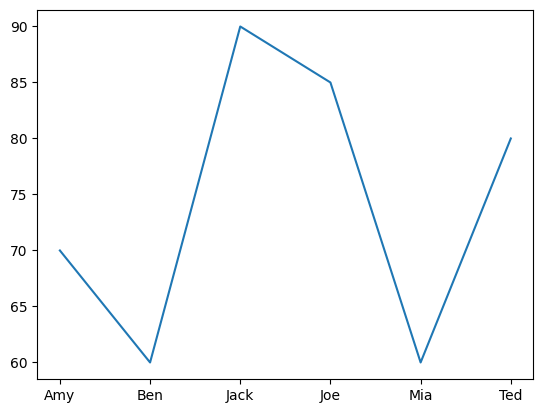
Line Plot#
test1_grades.plot();
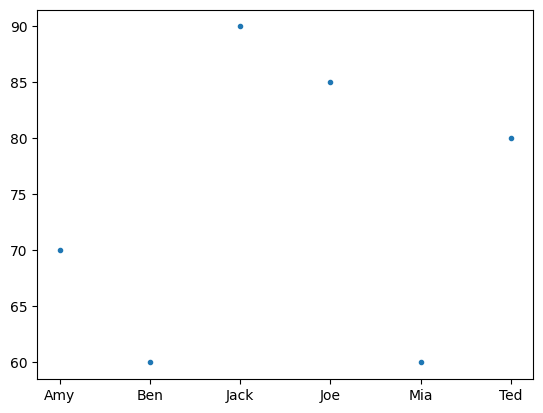
Scatter Plot#
test1_grades.plot(style='.');
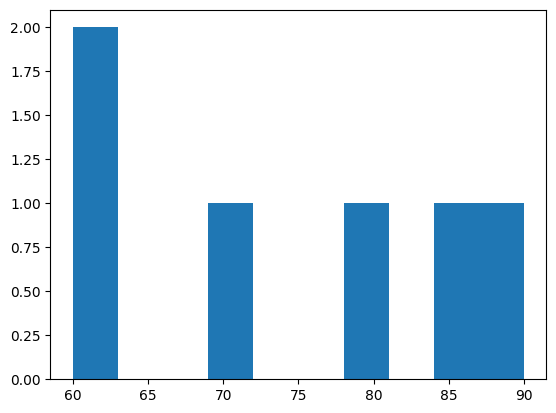
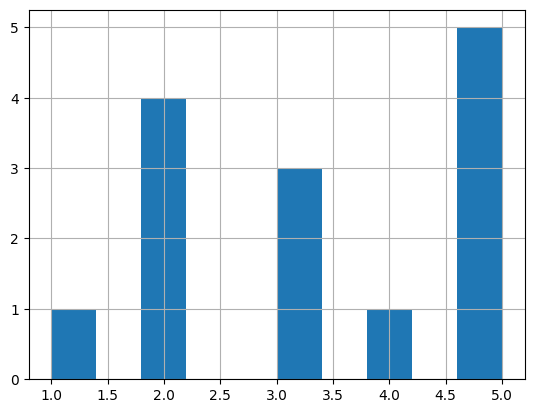
Histogram#
Distribution of values.
grade_series = pd.Series([1,2,2,2,2,3,3,3,4,5,5,5,5,5])
grade_series.hist();
Matplotlib and Series#
import matplotlib.pyplot as plt
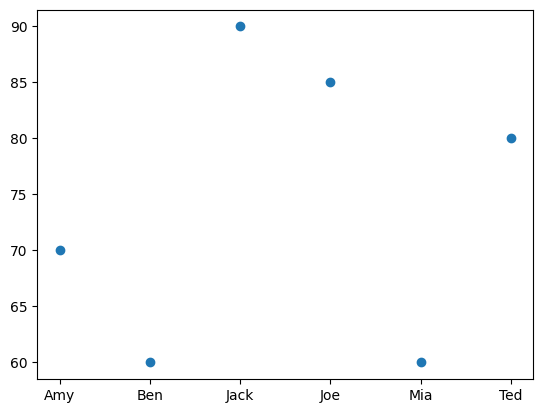
Scatter Plot#
x-coordinates should be provided.
test1_grades
Amy     70
Ben     60
Jack    90
Joe     85
Mia     60
Ted     80
Name: Test-1, dtype: int64
plt.scatter(test1_grades.index, test1_grades);
Line Plot#
The default x values are the indexes of the Series.
plt.plot(test1_grades);
Histogram#
plt.hist(test1_grades);